Posts

Showing posts with the label SP500

IB Net Payout Yields Model

Market Approaching 4 Years Highs
Image
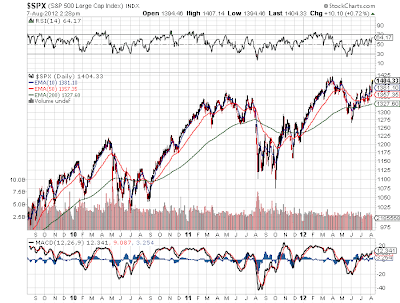
Quick, how many people expected the stock market to surge towards multi year highs at the start of August? The very time period where the market nearly fell off the cliff last summer. Even as the European issues continue to mount, it finally appears that the market has gotten past the never ending financial crisis. Not to mention that earnings report after earnings report provided solid numbers. Is the market finally able to focus on company specific events or will it be right back to the nuances in Europe as the Olympics end? In fact, maybe the Olympics have only hidden the issues as the world focuses on sporting events instead of financial issues. Don't be surprised to see next week bring out some fear mongering stories. For now, if your in the stock market just sit back and enjoy the gains while the average person is sitting on the sidelines watching stocks soar. 3 Year Chart - S&P 500 Disclsoure: No positions mentioned. Please review the d...

S&P 500 Approaches Recovery Highs

Image
Not many people probably realize this, but the S&P 500 is approaching the yearly highs and the post recovery highs. Back at the end of April the market peaked out around 1,420 and sold off down to 1,270. Amazingly though considering the turmoil still going on in Europe and the weakness in China, the market rallied to 1,386 on Friday. Placing it just a small rally away from those highs. See the chart below: Chart - S&P 500 Note the higher highs and lower lows over the last two months very much indicating a breakout. The small cap Russell 2000 has not had the same outcome. While not too far behind the large caps, the smaller cap index still remains below the July peak at 820 and further behind the end of March top around 850. Chart - Russell 2000  The main reason for the outperformance of the S&P 500 remains the popularity of dividend paying stocks that are more common in that index. As investors become more comfortable with the stock market and its ab...

Volatility Drops Even as Market Plunges

Image
Typically the Volatility Index ($VIX) does the inverse of the stock market. If the market plunges, investors seek protection and the $VIX soars.  Today the market close down roughly 1.5% yet the $VIX dropped 2.7%. On top of that, while the market has churned the last 3 trading days, the $VIX is much lower.  This could be a very bullish sign for the markets as less volatility tends to lead to better markets. Less fear and panic means investors are becoming more comfortable with the debt crisis in Europe. Maybe not more comfortable that all the plans will work, but clearly comfortable that the risks of a collapse have been removed.  Click to enlarge. 

5 Stages of Grief for Optimistic Dyslexics

Laszlo Birinyi remains one of our favorite market prognosticators with his willingness to literally stick his neck on the line with very bullish calls that the market will at least exceed 2,000 in the next 13 months. In other stories, he has even predicted the eventual bull market could top out around double the current level. Considering the typical analysts will hardly predict 1,450 on the market much less 1,500 his prediction really sticks out. Most analysts still debate whether the market will avoid another recession and anybody predicting doom and gloom obtains more press coverage. Below are some details and a clip from his interview on Breakout.  My only concern is that uber-bear and host Jeff Macke sure appears to be turning bullish. Or at least he doesn't push back on Laszlo that much allowing his bullish case to remain unscathed. Birinyi puts the market into context via a model which categorizes a bull move into a template of four phases. Think of it as the 5-stage...

Capitalized Corporate Profits Model

As corporate profits continue to hit all time highs, thought it was time again to review market valuations. While most investors expect higher year end stock valuations, most only expect modest gains from current levels because the market has run to fast since the March 2009 lows. As we've said on the this blog for the last couple of years, its not wise to use that panic low as a basis for historical measurements and average returns. The market collapsed like never before and should also rebound in a like manner. The SP500 is still considerably below its October 2007 high even though corporate profits have already surpassed those levels. Of course, valuing a market in the vacuum of a single data point can be dangerous. This is why the capitalized profits model factors in the 10-year Treasury Yield to calculate the estimated market valuation. Naturally lower rates should mean higher valuations as stocks become more attractive then bonds. Ironically from the chart below, the SP50...

Don't Expect a Market Correction Anytime This Year or Next

As the two year anniversary of this bull market that started in March 2009 has come and gone, it's time to actually review some of the facts surrounding typical bull markets. From listening to numerous media reports yesterday, its common place for analysts and hosts to spew out information without researching the past. From this Bloomberg article , numerous real facts about the market were revealed. It's also revealing that alot of the players that called the bottom remain bullish and alot of the cronies that called for a further correction are still bearish. Sometimes it makes you wonder if any of the so called bears had any real insight other then a broken clock is correct twice a day. It also makes me wonder if we'll say the same about the bulls down the road. Clearly a two year rally without a 20% correction seems impressive and sounds like a very long time. At least thats what you get from the typical media. But is it really all that impressive? According to resear...

Deutsche Bank Sees SP500 at 1,550 in 2011

We've followed Binky Chadha, Chief US Equity Strategist at Deutsche Bank, over the last year or two. While his calls for a higher market get moderate coverage on CNBC or Bloomberg, he doesn't get near the play as Doug Kass predicting 2011 as flat or the PIMCO guys predicting a 'new normal' or of course the doom and gloom gang. While 1,550 is a very aggressive 25% gain, its bullish that the market only gives him minor credibility though he has been accurate lately. Back in March he predicted the market would end the year at 1,325. As we suggested back then that number appeared too high, but it might not end much off the mark. Much more comfortable with a 1,400+ number next year as long as the market quickly dismisses such lofty targets. Watch the below video, but the key point is that average investors have likely not heard his prediction and quickly dismiss it.

Chart of the Day: Planning for a Pause

The stock market has been up huge since September 1st and now stands at the yearly highs in April. Will the market break to new highs? Do we want it to break on through? Great comments from Carter Worth on Fast Money last night. Carter is a charting expert that regularly appears on TV so its interesting to see his comments on how it's better for the market to rest for a few weeks before breaking higher.  That plays well into our theory that the market will reach new highs by year end, but a pause in the rally would be very healthy.

Intrade.Com Shows Nearly 50% Chance of Republicans Controlling Senate

In a dramatic surge, Intrade.com now suggests that the Republicans might just get control of the Senate. The odds have been relatively low most of the year until recently. Intrade shows a nearly 46% chance of Republicans gaining control up from a lowly 30% chance back on October 1st. This dramatic change is clearly being seen in the stock price surge in October. Less power for Obama means higher stock prices for a market trading at low valuations.

Apple Clears $300.... Still Cheap!

All the news today is about Apple (AAPL) clearing $300. Ok, maybe just the financial news because of the heroic rescue of the trapped Chilean miners. Its amazing though that the financial media still becomes fascinated with these psychological numbers. What does $300 really mean? Does it tell an investor anything about value, market cap, or future gains? No, no, no. Typically it can be assumed that a stock with a price tag above say $100 and likely $300 has had huge gains in the past and AAPL clearly meets that criteria. More importantly though what is the PE, growth rate, and market cap? Two of the previous three items suggests that AAPL has plenty of growth ahead. The third questions that permise. First, AAPL only trades at a forward PE of 17 based on average earnings estimates, but when using the more likely high end numbers around $22/share the PE drops to below 14. Historically low for a stock with the growth rates of AAPL. Second, revenue is expected to grow some 30% next yea...

China Roars For a 2nd Day

Image
After a 3% rise on Friday, China markets are soaring some 2.5% today. The Shanghai Index had been trading between 2600 and 2700 since late July and as of Friday it had finally broken above the range signaling a likely significant rise ahead. This is great news for bullish US investors as a breakdown the Chinese stock market and 2nd largest world economy could have doomed the US rally. As of midnight in New York, Shanghai is trading above 2800. On Tuesday the index is likely to consolidate back around the 200ema of 2744, but any pullbacks should be bought. The chart below doesn't show today's action, but the 2+ month channel that has been broken to the upside. Chinese investors clearly came back from the holiday in a buying mood.

Junk Bonds Continue Rallying Higher

Image
As we've reported in the past, Junk bond funds such as the Lehman High Yield Bond ETF (JNK) continues to rally higher as the stock market pauses at the June and August highs. Sure its people desperate for higher yields then the absurdly low Treasuries and even high grade corporates. The reality though is that it signals too many people placing emphasis on the direction of the stock market has how it relates to the economy. Investors wouldn't rush into JNK unless they were confident of a stable economy. Weakness in the stock market has much more to do with structural changes away from stock investing. This is just another signal that any pause at the 1130 range in the SP500 will likely be short lived. An assault on the April highs of 1220 is likely around the corner towards year end.

Doug Kass Calls a Bottom Again

So far he has been 2 for 2. Kass called the 'generational' bottom back in March 2009 and again called a bottom at the end of June leading to the large rally in July. He isn't overly bullish but he doesn't see the market going much lower with SP500 earnings of $90 next year. Stone Fox is much more bullish then Kass, but we do agree with his reasoning that the tax and regulation issues holding this market back will likely start to loosen up. The Democrats have a multitude of reasons to become more market friendly as their policies of the last couple of years have done nothing for job creation and the economy. Some bullish moves should help the market going into the November election. Kass has been the best caller of bottoms over the last couple of years so we'll stick with his predictions until he is proven wrong. Not to mention that the SP500 has a ton of support over the next 15-20 points lower so its not rewarding to go short at these levels. Clip from Fast M...

Junk Bond Funds Continue to Disagree with a Double DIp

Image
If Junk Bond investors (JNK) aren't scared of a double dip in the US economy, it makes us wonder why stock investors remain so concerned. After all, junk bond companies are always at the highest risk of default when the economy turns weak. Sure company balance sheets are very strong now, but that's only the companies that have high quality bonds such as IBM that recently borrowed at the unheard of 1% for 2 years. Any company that still has to pay a high yield must have a very weak balance sheet. Wouldn't have to pay high interest rates otherwise. These companies would be crushed if the economy fell into another recession. This dichotomy in the markets is perplexing. Either the SP500 will rally back to recent highs or this index will eventually roll over. Its interesting that JNK collapsed with the flash crash and corresponding drop to lows below the flash crash, but it has since not seen the same struggles as stocks. 

Downtrend Broken (For Now)

Image
It appears that the downtrend started on April 26th has finally been broken. Our at least for the moment because lately the market could just as easily whipsaw back down this afternoon. Bullish earnings reports from CAT, T, UPS, and others helped pushed the focus back to earnings and away from the rehashed story that Bernanke told yesterday. The key that most people seem to be missing is that corporate profits are based on what's going on in China, Southeast Asia, and South America as much as the US. So the economy can remain weak, but that doesn't mean that profits will follow the US. Stocks remain extremely undervalued because of the focus on valuing the market based on US weakness. As of 12:20cst, the market has actually broken above the 200ema which would be extremely bullish. Lately though it hasn't been able to hold these bullish levels so we'll need a good close and a positive follow through. Looking at the chart a close above 1088 breaks the downtrend and of cou...

Chart of the Day: Earnings Yield

Image
Earnings, earnings, earnings! Ultimately nothing matters more then earnings. You work for a paycheck or earnings. You invest for the earnings of the company. Unfortunately the stock market has become much more of a game of playing the technicals or riding the latest momentum trend when ultimately it should be about the future earnings potential of a company. That's the basic theme behind the philosophy of Warren Buffett. Lots of other investors chase dividend yields or the safety of treasuries. Amazingly very little is talked about the earnings yield of stocks or investments. Good SP500 stocks can yield 3 or 4% and is some cases even 6 or 7% dividends. What does that really mean? Can they really afford to pay that dividend or can they afford to pay a ton more. Heck even our Net Payout Yield Portfolio that has beaten the market on average of 5%+ over the last 3+ years only focuses on buyback + dividends and nothing on the earnings yield. Sure its a sign of the cash flow coming plus ...

SP500 Could Hit 3,000 By 2020

Interesting to actually see a bullish clip on Yahoo's Tech Ticker. This service typically rehashes the bear case over and over. John Markham, Marketwatch columnist, has been bullish for a while and basically encapsulates our thesis. Lots of issues still exist such as the potential increases in capital gains taxes, sovereign debt, and so many other issues. Regardless though, the majority of investors remain rather bearish via pumping money into corporate debt. Almost ironic that after a debt bubble people would be so willing to lend money to debtors. His points about the SP500 hitting 3,000 are very sound and logical though rejected by just about anybody. After a lost decade in stocks, everybody should be pouring money into equities but instead they are racing into bonds at historically low rates. What is the odds of a 2nd lost decade in stocks? Oddly most people would've been more comfortable investing in stocks in 2000 before the bubble burst then in 2009 when the market h...

44 Days and Counting......

Image
If you follow the market at all, you've probably heard numerous stories about this market being overbought or overextended. Bespoke had good stats a couple days back about the historical nature of this run since 1990. True it's one of the longest streaks so that does cause some concern, but at the same time this recent market and the Great Recession have been historical so why wouldn't this rally? During the 1994 and 1995 rally the market had 2 stretches of roughly 70 days where the market didn't have a pullback of 1%. It would not shock me at all to see that record broken. It also wouldn't shock me to see a 2% pullback tomorrow. For the record to break, we're looking at 5 more weeks without a big selloff. Seems absurd, but do you really want to bet against it? Most people seem to expect a selloff even when history provides evidence that these abnormal scenarios tend to always happen after recessions. The facts from the below report suggest that we are in fact...

Regional Banks on Fire Today

Image
Most importantly to us, Regions Financial (RF) and Synovous Financial (SNV) our both up sharply today. For RF its clearly partly technical as they hit new 52 week highs and breakout from a double top. For SNV its like just a move with the sector today. Cramer was bullish on banks yesterday and in general the tone seems to be improving. The Opportunistic/CVIM Model is doing the best today as it has a higher concentration in those 2 stocks while the Growth Portfolio is also gaining in large part to a high concentration in the financial sector at roughly 20%. Though it contains much more of Hartford Financial (HIG) and ICICI (IBN) then these 2 regional banks. The chart on RF looks similar to how we expect the SP500 to go over the next few weeks. Initial weakness at the recent high (Jan in the case of the SP500) and then support from the rising 20ema and an eventual push to new highs on the 3rd try at 1150. SP500 Finally the chart of SNV. Not as impressive as RF. Still need to work thru s...

SP500 Bounces Above Key Technical Levels

Image
As we wrote yesterday on the Consumer Confidence report, the market drop was as technical as it was related to the supposed lack of confidence. We mentioned that the 20/250EMAs were very crucial junctures and it's not surprising to see the market drop back down to test the support before continuing the rebound. Today, we saw a solid bounce back above the support. Now any move about the 1110 -1112 range will likely lead to a retest of the 1150 highs and possibly a move to the pre Lehman levels of 1200-1250.