Posts

Showing posts with the label SPX

IB Net Payout Yields Model

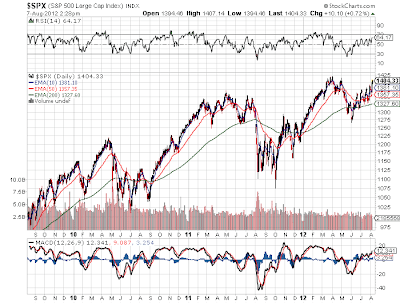
Market Approaching 4 Years Highs
Image
Quick, how many people expected the stock market to surge towards multi year highs at the start of August? The very time period where the market nearly fell off the cliff last summer. Even as the European issues continue to mount, it finally appears that the market has gotten past the never ending financial crisis. Not to mention that earnings report after earnings report provided solid numbers. Is the market finally able to focus on company specific events or will it be right back to the nuances in Europe as the Olympics end? In fact, maybe the Olympics have only hidden the issues as the world focuses on sporting events instead of financial issues. Don't be surprised to see next week bring out some fear mongering stories. For now, if your in the stock market just sit back and enjoy the gains while the average person is sitting on the sidelines watching stocks soar. 3 Year Chart - S&P 500 Disclsoure: No positions mentioned. Please review the d...

S&P 500 Approaches Recovery Highs

Image
Not many people probably realize this, but the S&P 500 is approaching the yearly highs and the post recovery highs. Back at the end of April the market peaked out around 1,420 and sold off down to 1,270. Amazingly though considering the turmoil still going on in Europe and the weakness in China, the market rallied to 1,386 on Friday. Placing it just a small rally away from those highs. See the chart below: Chart - S&P 500 Note the higher highs and lower lows over the last two months very much indicating a breakout. The small cap Russell 2000 has not had the same outcome. While not too far behind the large caps, the smaller cap index still remains below the July peak at 820 and further behind the end of March top around 850. Chart - Russell 2000  The main reason for the outperformance of the S&P 500 remains the popularity of dividend paying stocks that are more common in that index. As investors become more comfortable with the stock market and its ab...

Capitalized Corporate Profits Model

As corporate profits continue to hit all time highs, thought it was time again to review market valuations. While most investors expect higher year end stock valuations, most only expect modest gains from current levels because the market has run to fast since the March 2009 lows. As we've said on the this blog for the last couple of years, its not wise to use that panic low as a basis for historical measurements and average returns. The market collapsed like never before and should also rebound in a like manner. The SP500 is still considerably below its October 2007 high even though corporate profits have already surpassed those levels. Of course, valuing a market in the vacuum of a single data point can be dangerous. This is why the capitalized profits model factors in the 10-year Treasury Yield to calculate the estimated market valuation. Naturally lower rates should mean higher valuations as stocks become more attractive then bonds. Ironically from the chart below, the SP50...