Posts

Showing posts with the label Ciovacco Capital Management

IB Net Payout Yields Model

Bullish Sentiment Can Be Bullish

In a time and age where every investor sentiment indicator is used as a contraian figure, its likely that most of the analysts spewing such non-sense haven't ever reviewed whether it is factual. First, just because a sentiment figure is calculated it doesn't mean that the pollsters are actually rigorous in their answers. Its easy to say your bullish these days, but not likely as easy to have actually invested cold, hard cash. Hasn't the consumer sentiment numbers taught us over the years that spending doesn't always match sentiment. Second, being initially bullish doesn't mean that investors can't an won't remain bullish for a long time. Opinions don't seem to swing that quickly. Ciovacco Capital did some interesting work on investor sentiment and found out that it's not as indicative of a pending market crash as the procrastinators on TV would suggest. They worked with Robert Colby, author of The Encyclopedia of Technical Market Analysis , to bet...

CCM Bull Market Sustainability Index (BMSI)

Image
Ciovacco Capital Management has been working on an index to predict the sustainability of bull markets or the BMSI . Basically the goal of all investors is to determine when to let your winners run and when to dump stocks. Any of these indexes are generally based on the concepts of the Leading Economic Indicators that we harp on so much. For example, the spread in the short and long term interest rates is a huge indicator of future economic growth. That indicator flat lines and people should flee stocks. Not sure they've posted all of the 30 leading market indicators included in the study, but its interesting to note that it still flashes an extremely bullish case. Basically the same numbers as back in late 2004 before the market made its run over the next few years from 1,150 to 1,550. As usual such indicators are always designed with the numbers that would've predicted the past corrections and booms. Sometimes though they aren't that great at predicting the future. Change...

Market Melt Up Scenario Remains in Play

Image
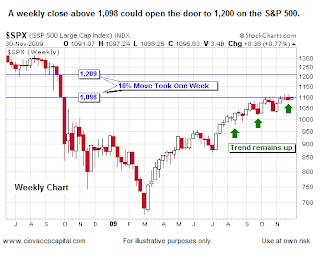
Several months ago Stone Fox Capital suggested that the market could 'Melt Up' in a scenario similar to how it melted down last year. During the span of a few weeks the market quickly dropped from above 1,200 to below 900. When this happens either on the way up or on the way down, it leaves very little resistance when the market revisits those levels in the opposite direction. The market has been stuck around 1,100 for several weeks now so its likely to either move quickly higher to the 1,200+ level or finally have that 10%+ correction that everybody on Wall St wants. The below chart from Ciovacco Capital highlights that potential. It seems unlikely that this surge off the bottom will end in a whimper but rather a blow off top with money rushing in from the sidelines. Since we've highlighted that such huge rallies off a bottom after a major market decline never end at year end and usually last more then a year, it seems unlikely that a correction is pending. The more lik...

Correction-less Rallies

Great report from Ciovacco Capital Management . It shows that bull market rallies from corrections of 35% or more tend to last alot longer then most people think. In fact everybody clamoring for a market correction of 10% have been amazingly off based from the historical norms. Clearly a correction for corrections sake isn't how the market works. On average the market rallies 270 days or nearly 9 months after a major correction in the markets crosses back above the 200 MA. This means that the rally will last at least until early spring as the SP500 didn't cross back above the 200 MA until July 10th meaning the rally has really just begun. It's important everybody catches that part. Its not the market low of March 9th, but rather the point where the market became technically strong by crossing the 200 MA. Probably the most likely comparison was the 1942-43 rally that lasted a whopping 372 days. In a lot of ways this economy has been compared alot to the depression. Since w...