Posts

Showing posts from 2008

IB Net Payout Yields Model

Orange County Supply of Homes near 2 year low

This little nugget is reported in the OC Register. You won't hear this news from the mainstream media, but we've been reporting on this for several months. The supply of homes in the epicenter of the housing problem of Orange County in California is declining at a fast rate. Inventory peaked at nearly 18K homes September 2007 and has steadily dropped to below 12K now. Whats really interesting is that houses under $750K have a reasonably low turnover of only 5 months. The critics would claim that houses are being held off the market due to the drastically lower prices, therefore, reducing inventories. In reality though, the lack of willing sellers at these levels combined with more buyers coming in at these low prices is what creates a bottom and a reversal in the market. The stats don't lie and they definitely show how inventory levels kept growing and peaked in the late summer when supply was too high, but in 2008 inventory peaked in March. Don't be surprised when CA

Dec 2009 Oil Trades at $55

Image
Don't be fooled by the quotes of oil trading in the $30s last week. The current quotes for just about all forward months is above $50. The chart above is for the Dec '09 contract and it's currently trading for above $55 on the NYMEX. The supposed culprit for the current low prices is that the Cushing terminal is flooded with oil, therefore, requiring all excess oil to be dumped on the markets. Long term though the OPEC cuts and expectation that demand will eventually rebound has future months considerably higher. These higher future prices will undoubtedly help justify some of the long term projects being considered in the oil markets. Too much focus on last months prices missed the reality of the long term prices.

Asset versus Market Value at SHLD

Commentary from Change Alley on the ridiculous market value placed on Sears Holdings stock (SHLD). Basically repeats some of what I've posted here before, but probably more eloquently. My favorite comment plus a great quote from Benjamin Graham: However, the large short interest in Sears strikes me as attempting to pick up nickels in front of a bulldozer; the real estate value is a massive imbalance that is incredibly clear-cut, paired with an aggressive stock buyback plan. The true investor scarcely ever is forced to sell his shares, and at all other times he is free to disregard the current price quotation. He need pay attention to it and act upon it only to the extent that it suits his book, and no more. Thus the investor who permits himself to be stampeded or unduly worried by unjustified market declines in his holdings is perversely transforming his basic advantage into a basic disadvantage. That man would be better off if his stocks had no market quotation at all, for he wou

Buyout Expert Having Problems Raising Cash

More signs of the times. NY Post has a report on Blackstone head Schwarzman being eager to make buyouts in this economy, but having trouble raising the cash. In normal times, he'd easily raise the money, but funny how during a weak market people are least willing to invest with him. Seems odd because his company is probably best served for profiting from the current environment. As usual people buy at the top and sell at the bottom. At some point in the near future, you'll see companies like Blackstone go on buying sprees. Low interest rates would usually allow for huge deals to take place, but the frozen credit markets are preventing the normal business process to take place. When that happens, watch out. We'll likely see 12 months of unprecedented buyouts.

NBER declares Recession started December 2007

According to this Reuters report, NBER has declared the recession is already 12 months old and within stricking distance of the longest post Great Depression recession on record. This isn't that surprising to anybody following the market. Though the surprising part is that the recession officially started in December of last year even though we had good, positive GDP growth in the first half of 2008. Alot on Wall Stree feared that the recession didn't start until the summer and would need as much as 18 more months to run its course. Now we likely are looking closer to the end then the beginning. Whats interesting though is that NBER has a history of calling recessions when they are just about to end. The last recession in 2001 was called exactly the month that they later declared as the end. Does their declaration put and end to the rampant speculation of the recession and force people to finally start thinking about the end? History definitely shows that the call a recession

Chart of the Day: Capitulation Phase Over?

Actually this is the Chartiest of the Day report. Carter Worth on CNBC gave his reasonings for the market lows being hit on Oct 1oth follow by the lower low on Nov 21st which technically confirmed the Oct low since it only stayed below for 1 day. Carter was pretty accurate on the way down so I have faith in the guy. Interesting view which makes it seem like you should accumulate stocks around the S&P 840 low and look to sell any big gains at close to 990 at least for now. The market has clearly oversold, but he makes some good points on why the market won't rally big for now. He also said that because we've breached the lows of Oct. 10, in the short term, the market will be directionless. “The capitulation phase of the bear market is over. Now we’re heading into the apathy phase,” he says. “We’re stuck in a range with 990 being the top and 790 being the bottom.” Interesting comments on BMY. BMY has been one of our favorites in the Net Payout Yield portfolio.

Stat of the Day: Dividend Yields above Bond Yields

Image
In the last 45 years, the market has never seen the dividend yield of stocks even approach the 10 yr Treasury yield. Though this chart doesn't show it, the last time the dividend yield exceeded the bond yield was 1958. Whats even more incredible is that dividends aren't nearly as popular over the last 10 years. The Net Payout Yield would drastically exceed the bond yield now due to huge buybacks. This is definitely not the time to abandon stocks for low yielding bonds. Its exactly the time to buy some aggresive small caps or Net Payout Yield stocks if you want less risk.

More Signs of a Housing Bottom in Orange County

Interesting article in the LA Times about a real estate boom in Santa Anna. 10x the sales volume of last year and houses receiving multiple offers sure sounds like a bottom. When somebody has to make an offer on 3 houses before getting a house, its difficult for the market to fall. Definitely a sign of demand outstripping supply at the current levels though its key to note that its 45% below the peak levels. Still, investors will have more confidence in banks once the housing market has hit bottom. Banks also will be more willing to lend money. Also, its interesting to note how bearish the article is about possible future declines due to job loses and such. Overly bearish if you ask me. All told, 357 homes in Santa Ana were in escrow in October, almost 10 times the volume of a year ago. Debini said the house they bought was actually the third they bid on. All of the foreclosed houses they pursued drew multiple offers, and they were outbid in their two previous attempts, she said.

Stat of the Day: Biggest PPI Drop on Record

Image
Today we got yet another record: the largest PPI drop ever. At a drop of 2.8%, Wholesale prices are dropping at a dramatic rate. These reduced costs should help most businesses save money and increase profits leading to additional spending. The previous low was Oct of 2001 yet another period that was the near the lows of a bear market. The market continues to match or set records that were last reached at market lows whether Yield Curves, Valuations, or Costs. These indicators alone never tell us when the bottom has been reached, but they all add up to being much closer to the bottom then the top.

Stat of the Day: Off the Charts Yield Curve

Image
Another indication of the whackiness in this market. The yield curve is now off the charts bullish. This usually has a very positive impact on future bank earnings, but in a market where lending is limited its difficult to determine if the impact will be like normal cycles. Typically banks are encouraged to lend like crazy because the spread is so positive for them, but that isn't happening this time because of the financial crisis. You can bet though at some point in the future, this yield curve will help return the market to growth and inflation. In fact, its likely to cause irrational investments as it always does at the peaks and troughs. This number is off the charts because of the huge compression in the rates of the T-bill. Its unlike anything the market as seen even in the last 25 years. Anytime this ratio gets above 2 it becomes very bullish for the future economy. The markets tend to forget that in periods of extreme bullishness or negativity that such monetary realities

Hedge Funds Raising Cash

Lots of reports have contributed the huge market declines in Sept and Oct to liquidations and forced selling by hedge funds. Based on this article, it's becoming very clear that alot of hedge funds have over liquidated. Though funds aren't required to report cash positions the numbers add up to a good portion of funds already having sizeable cash positions. In some cases such as BP Capital, funds have already moved to mostly cash. These drastic moves put alot of cash available for reinvesting in the market once a rebound occurs. Adds more fuel to the argument that an eventual rally could be just as fast as the deline. Below are some samples of firms that have drastically reduced their reporting holdings during Q3 and in most cases the cash position has been identified as 30, 40, 50% and sometimes even more. That money can't remain on the sidelines forever and at least for these funds the selling will be limited going forward. Hedge-fund manager David Tepper entered the th

China Stimulous Plan - $586B

Image
By now I'm sure just about everybody has heard about the details of the stimulous plan out of China today. A lot of debate has taken place over whether its really new spending or mostly just a rehash of existing plans such as the earthquake rebuild. Regardless, the Chinesse economy is likely to benefit from these additional funds being spent. APWR is our favorite stock based on this news as any increase in demand in China will just further stress the power grid in mainland China requiring the services of APWR. APWR has been crushed due to its speculative appearance and the drop in the China markets, but it has a huge $800M backlog plus another potential $300M deal in the works. Not to mention, APWR is just now producing windmills that will provide for a substantial boost to the bottom line. Looking for a stock that will indirectly benefit from this stimulous plana and you need look no further. Even the chart is starting to look more bullish.

GM Target Set at $0

Not sure I've seen a analyst come out with a $0 target, especially on a DOW stock. According to this article, Deutsche Bank cut GM to 'sell' with a target price of $0. While Obama has already stated that he is behind some sort of help for the ailing US automakers, the pressue seems high that taxpayers not be impacted. These analysts seem to think GM might get a AIG type of deal where the shareholders are basically diluted out of existense. The issue is that any GM deal needs to get major concessions from labor to make them able to compete with the likes of Honda and Toyota. Otherwise, why not let them go bankrupt and see what happens to their labor deals. Constantly saving overpriced contracts will never solve the problem. Either way, I'd stay away from the stocks of GM and Ford until this all shakesout. While further government assistance would decrease the likelihood of a GM bankruptcy, we believe any government assistance would likely significantly dilute GM's e

Stat of the Day: Stock Allocation at 58%

Image
From the chart above, Bespoke provides a nice picture of how the market has become so momentum based. Stocks fall and the allocation recommendation for stocks drops as well. Most analysts would advise the opposite if writing a textbook, but when it comes to real world applications it seems that people pull out of stocks at the lows and pile in at the highs. This is another of the historical indications we have regarding buying stocks now. The average recommendation has dropped from 68% to 58% even though the market is back to the area of the 2003 lows. Just another indication of how the attitude towards stocks has dramatically shifted since 2000. With gas prices and interest rates falling on a daily basis, its difficult to envision how the market will remain weak much longer. Americans like to spend and the stars are aligning for a great big shopping spree. Valuations and just too cheap to ignore.

The Obama Rally?

As we watch the S&P500 surge 4% to over 1,000, it has probably caught alot of people off guard expecting a further selloff with Obama likely to win the election today. The market has enjoyed a nice rally the last couple of weeks following widespread panic selling and hedge fund liquidations over the previous couple of months. We're now likely seeing a rebound as the market is now seeing more certainty with the election finally happening. The market has likely more then discounted a Obama win and is now coming to grips with the facts that the world won't end. In fact, we've lately heard that Obama will likely delay the expected tax increases until maybe 2010 at the earliest. As usual it appears the market has priced in the worst case scenario and now is waking up the reality that world isn't going to end. After such a huge run, it's likely that the market will use the 1,000 point area as a place to pause before the ultimate rally. We'll likely see 940 or 960

Dirt Cheap Valuations

Now Jeremy Siegel joins us in an article at Yahoo! Finance . This guy is known for being very conservative in his approach to the stock market and constantly warned about overvalued stocks in the late 90s. He is bullish on not only the US market but the Worldwide market. The PE ratios in part of Europe and Asia are remarkedbly low in the 7s. Check out his summary of the world markets PEs. He makes a compelling case of using normalized earnings to value stocks. Otherwise, throw out the peak and trough or outsized gains and losses to focus on the core earnings level. Do you really want to value a stock based on the current weak economy or based on what it would earn if the economy was growing 2-3%? Just like you shouldn't value a stock based on what it earns when the economy is growing at 5%. That isn't sustainable and neither will be any valuation assigned to that growth. I believe that stock prices are now so extraordinarily cheap that I would be very surprised that if an inves

Is Sears Holdings (SHLD) the Next VW?

If you missed the VW story from yesterday, Porsche bought basically all the outstanding float in VW forcing panicked trading by the 12% of shares short. Anybody attempting to cover or forced to cover had virtually nobody left to sell in the open market. This forced the stock trading on the DAX up nearly 500% and briefly gave VW the largest market cap in the world over Exxon. Gotta love the free market system that spins out of control. Volkswagen’s stock soared to as high as 1,005 euros a share, about $1,258, on Tuesday before closing at 918 euros. The shares ended last week at 210 euros. The rise appears to have come from a short squeeze of historic proportions, as speculators who had borrowed the stock and sold it scrambled to buy shares. Many had expected the share price to fall after Porsche gained control and stopped buying shares. All this brings me to the story regarding Sears Holdings (SHLD). Most people commonly know it as the owner of retail gians Sears and KMart or by it'

Pickens BP Capital now at 100% Cash

Incredibly T. Boone Pickens BP Capital hedge fund has gone from fully invested in the global growth of energy demands to one that is no longer invested at all. According to this report , his fund has had over 50% redemptions. This just adds to the long list of funds that have now deleveraged and gone to significant cash levels. It also will add fuel to the fire of any rebound. Roughly half the investors in T. Boone Pickens' BP Capital hedge fund have asked to withdraw their money after losses of about 60 percent this year, a source familiar with the situation said on Tuesday. The Texas oil tycoon and his investment fund, which had invested primarily in the energy sector, have lost about $2 billion since peaking in late June, the source said. BP Capital's losses this year come after five years of gains, with annual returns reaching as high as 119.5 percent in 2003 during the commodities boom that began in 2002.

Stat of the Day: Consumer Confidence Lowest on Record

According to the Conference Board , it's consumer confidence index fell to its lowest level since they began tracking it in 1967. This isn't surprising considering the large drops in housing prices and stocks. It's definitely a sign that consumers are gloomy. Does it mean that consumers won't spend? Thats yet to be seen as this report usually doesn't match what consumers actually spend. Some random consumer answers a phone and responds that they are gloomy then they go out to the mall and buy some clothes. Thats basically how the reporting works. Falling gas prices are more likely to impact consumer spending then the stock market or a house. Gas more directly impacts the monthly budget of most consumers, while big ticket items are the ones most likely impacted by housing and stock declines. So expect a weak holiday, but don't bet the house that this report accurately reflects spending. The Conference Board said the consumer confidence index fell to 38, down from

Stat of the Day: S&P500 Earnings Yield hits 10.76%

Doesn't take long for the yield to soar from the report I posted last week. We'll keep hammering home this theme that the market continues to be the cheapest valuation that we've seen in a very long time. Not much to follow up on this theme as this measure continues to be at the exact inverse of the 2000 bubble. Hmm....

ICICI Bank (IBN) reports decent quarter

How good is this Indian bank that they reported stronger results YOY even though they had nearly $300M more in loan provisions. The ability to lower expenses so drastically even though they grew deposits and loans speaks to the efficiency of this bank. -- Profit after tax of US $216M; 39% increase over first quarter -- 42% year-on-year increase in core operating profit (excludes the huge swings in treasury income) -- 12% year-on-year reduction in costs due to cost rationalization measures -- Capital adequacy of 14.01% -- CASA ratio increased to 30% from 25% a year ago IBN continues to launch both domestic and international growth where they can utilize non-resident Indians as customers and a low cost structure in India to run these international operations at lower costs. At October 22, 2008, the Bank had 1,400 branches and 4,530 ATMs. (State Bank of India has 10,000 branches) Current and savings account deposits increased 16% to Rs. 66,914 crore (US$ 14.2 billion) at September 30,

Stat of the Day: S&P 500 Earnings Yield at 9.88%

Image
Considering that the 10 year note is at only 3.76%, this is a considerably wide and unheard of spread between the note and the S&P500 earnings yield. This is the widest spread in the last 30 years and maybe in history if I could find a report going back that far. What this data shows is that anybody invested in a S&P500 stock would earn 10% on his investment while only earning 3.76% on a safe government note. Meaning that if credit was available, the market would see a high amount of leveraged buyouts. Borrow using cheap credit and make money on the spread. Basically a continuation of the private equity buyouts that began in 2002 when the market first got really cheap. Bankstocks.com has a nice little article that summarizes the bullishness now being seen in the private equity realm due to these very, very attractive valuations. When Henry Kravis and Steve Schwartzman become bullish on valuations, you should expect a big flurry of deals to be announced. Its only a matter of th

E*Trade (ETFC) posts another big loss

Well at least thats the headline that you'll read. The real interesting note is that the CEO claimed that loss provisions have peaked in Q3. Stay tuned on ETFC as they still have a solid online brokerage that is very profitable. They also have access to the new government Capital infusion and TARP programs so the combination should provide any liquidity if needed. These options pretty much takes any bankruptcy fears off the table. Without BK fears, ETFC has a bright future once the current mortgage loans are run off. Anybody doing a quick valuation of Ameritrade (AMTD) will quickly gather that a E*Trade without the shackles of non-performing loans would be very valuable. Stay tuned as this stock should get interesting!

Millicom (MICC) posts decent earnings considering

Thats the good news. Unfortunately Millicom International Cellular's (MICC) stock dropped 33% today. It's difficult to follow what the market saw that was so scary about the report. A 27% increase in revenues followed by a 25% increase in EBITDA seems rather impressive in this economy. Especially considering the low valuation level of 2.7x EBITDA that MICC now trades at. Does valuation not matter any more? Highlights of the Q3 report: 53% increase in subscribers for Q3 08 versus Q3 07, bringing total subscribers to 30.6 million 27% increase in revenues for Q3 08 to $869 million (Q3 07: $686 million) 25% increase in EBITDA for Q3 08 to $369 million (Q3 07: $296 million) 17% increase in net profit for Q3 08 of $161 million (Q3 07: $138 million) Basic earnings per common share for Q3 08 of $1.49 (Q3 07: $1.36) Millicom International Cellular S.A. is a global telecommunications group with mobile telephony operations in 16 countries in Asia, Central America, South America, and Afric

Stat of the Day II: Unprecedented Low Valuations

Image
Valuations continue to be at unprecedented low levels as this Valueline Appreciation Potential chart shows levels only matched twice in the last 40 years. This is a theme that we''ll continue to harp on over the coming weeks. As this chart shows, valuations match only the 1974 and 1982 levels. On these 2 occasions over the next 12 months, stock market returns were very positive with an average gain of 28%. This is yet another confirmation of the cheap valuations as other methods show an even more bullish scenario for this time period. Low interest rates and high cash hordes as documented in other posts seperate this time period from even those prior low periods.

Stat of the Day: Southern California home sales up 65% from last year

Now this did occur before the Oct melt down in the financial markets, but it's a very encouraging that the price drops have finally led to more buyers. According to this LA Times story the median price is down 33% from the peak last year. Sales were also up from August and the hardest hit county of Riverside saw the biggest sales increase of 106%. Doesn't appear that there is a lack of qualified buyers when the price hits an attractive level. Thats an estimated $6B worth of new mortgages and roughly $9B as the original value that just left the books of weak mortgage holders and ended up in the hands of strong, financially solid holders. The median Southern California home sales price was $308,500 in September, the lowest since May 2003 and down 33% from the September 2007 peak of $462,000 The number of homes sold in Los Angeles, Orange, San Bernardino, Riverside, Ventura and San Diego counties shot up 65% compared with September 2007. A total of 20,497 homes closed escrow i

Stat of the Day II: Market Swings 2nd Highest in History

Image
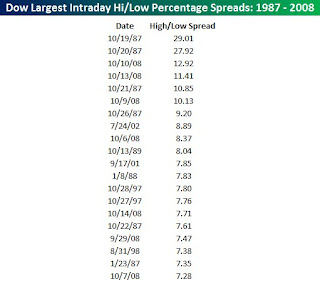
The guys of Bespoke came up with this interesting chart. The last 2 weeks have have had some of the most volatile intraday percentage swings on the DOW. In fact, only the wild drops in 1987 surpass the swings we saw on 10/9, 10/10 & 10/13. Todays move is close to making the list but might come up short. We're definitely in volatile times these days that favors traders over investors. The market looks like it wants to retest the lows or at least the close from Friday. My guess would be that alot of money is sitting around waiting for that confirmation. Should be an interesting next couple of trading sessions.

Stat of the Day: Gasoline demand down 9% YOY

Gasoline demand continues to plummett year over year according to Mastercard report . It seems that part of the destruction in demand could just be temporary as people spent the last couple of weeks sitting around watching the credit crsis and markets explode. Demand did pick up from the previous week. All in all, the national averages still haven't come down far enough to spark demand. As they approach $3 I'd expect a fair amount of pick up though still lower then last years levels. It'll be interesting to see how fuel efficiency plays into demand over the next couple of year. Would like to see a report that shows miles driven versus gas consumed. Some highlights: Average national demand for gasoline dropped 9.7 percent compared with the same period last year, MasterCard said in its weekly SpendingPulse report. "This is the first time that we've had two consecutive weeks of pumping, in terms of year-over-year comparison, that were below 6 percent," McNamara s

Hedged Growth Positive for Oct

Though just slightly positive at $2,300 on a $1M virtual portfolio this is a really significant accomplishment considering the nearly 15% loss in the S&P500 for the month to date. The portfolio has a long mandate with the 1/3 position in Net Payout Yield stocks so this portion of the portfolio has been negative. Boeing, Disney, and Home Depot though are the only stocks that have worst performances then the market. Fortunately though the portfolio has been very heavy in cash due to the environment providing a mostly neutral stance for the Growth and Short portions. The Short position of the SRS ultrashort real estate position has returned 40% to offset some of the losses. The biggest benefit is that the portfolio leaned in with more Growth on Friday afternoon with purchases of Apple and NYSE Euronext. These positions have averaged 20% gains since those purchases. Also the Morgan Stanley and Regions Financial bets have combined for breakeven performances after being down substantiall

Poll of the Day: Was Yesterday's Rally for Real?

The guys at Bespoke have this interesting poll today - Was the Rally for Real? As of this posting, over 51% of the voters think the rally won't last. While basically a 50/50 result, I still find it interesting that so many investors remain that bearish. After a historical 900+ point rally on the DOW, the market still can't find many bulls. Good sign that the rally might finally have legs. The experts say that it usually takes a 3 day rally to solidify a reversal from a bearish trend. We'll be watching to see if that happens and looking to add to the growth stocks in the Growth and Hedged Growth portfolios.

Net Payout Yield Slightly Outperforms

Its difficult to get too excited by a portfolio down 17.3% last week. On a relative basis, it was over 0.8% better then the S&P500s 18.1% loss. Great, but nothing to write home about. This portfolio is definitely designed to outperform on a relative basis and hence doesn't have any shorts to benefit it on the downside. Considering its goal, it was a successful week since its goal is to just beat the market on a relative basis whether rain or shine. When the market is pouring losses, it'll likely do the same. The portfolio has outperformed the market MTD and over the brutal last month. Not bad considering the portfolio has some growth stocks which will definitely lead to out performance in a bull market. This portfolio continues to perform for those willing to accept market risk and not wanting to time the market. The best part is that this is the type of portfolio that should allow you to sleep at night. Net Payout Yield stocks gain market share and buyback large quantities

Growth Outperforms by 3% MTD

For a portfolio that is very aggressively invested, I'm proud to report that it has outperformed the S&P500 during the worst week ever by 2.3%.The S&P500 was down 18.1% vs 15.9% for the Growth fund. The portfolio is also ahead MTD and over the last 3 months. This may be the first time in my investing career that I've done better then the markets during a 3 month period that the market is down 27%. This was achieved because of my bet that oil had peaked in July mainly due to slacking demand when gas hit $4. Hence I invested in DUG (Ultrashort Oil & Gas). This position has paid off nicely to the tune of a 150% and over $90K in gains in 3 short months. On Friday's open, DUG soared up to the upper 70s so I chose to cash in 2/3s of the position. After watching it soar further to 85, I cut the remaining position at 80 as it seemed like the typical blowoff top that is followed by steep declines. With this substantial sell, I bought an 8% position in APPL in the lows 90

Hedged Growth Outperforms by 17% in 1st 10 days

What a time to start this new portfolio. In its first 10 days of existence, the market is down 22.8% (thats a Bear market all by its self - wow!) while the Hedged Growth portfolio was only down 5.6%. Thats a whopping 17% outperformance. Considering the bearish tone of the market the portfolio stayed mostly neutral besides the 1/3 invested in the Net Payout Yield stocks. The Ultrashort Com'l Real Estate position (SRS) is up 41% so that helped as well. That was offset by the position in Morgan Stanley (MS) that hasn't paid off down 60%. Also helping was the 5% position buys in APPL and NYX close to the lows of the day on 10/10. Both ended the day with over 5% gains. Having $435K or 45% of the original value in cash or SHV (short term treasuries) helped keep the portfolio loss to a minimum though a much larger short position would've kept the portfolio closer to breakeven. Next weeks outlook favors a market bounce after any initial drops on Mon or Tues due to fund redempti

Trade: Buy Apple, Sell DUG

On the huge selloff this am I made the following trades. Bought Apple (APPL) for the Growth and Hedged Growth Portfolios in the low 90s. Sold 2/3s of the DUG (Ultrashort Oil and Gas ETF) in the upper 70s. APPL has a $20B cash position and no debt. Currently trade at 10x cash flow with substantially higher growth even considering the slowdown. With the cash position, APPL should be able to gain market share in this downturn. The growth portfolio has made a 150%+ gain on the DUG investment. With todays huge selloff, it just seemed the right time to cash in. Market wants to turn and we don't want to lose the gains. Edit: Added NYX to Hedged Growth b/c it has a strong balance sheet and no credit risk. Sold the remaining DUG shares at 80. Added WFC & CAT to the Net Payout Yield portion of the Hedged Growth fund. Both are strong companies really beated up and that portfolio was still in signifiacnt levels of cash.

Stat of the Day: 6 Day Losing Streak

While not all that rare, the six consecutive loses on all 3 exchanges hasn't happened since January 1991. As I post this, the markets are headed yet again towards another loss. While 7 days is somewhat rare, the longest losing streaks are 12 days on the DOW and S&P500 and an astounding 16 days on the NASDAQ. CNBC has a good summary of the 6, 7, and 8 day streaks for each market. Edit: Make that 7 straight down days. Haven't ran the numbers, but it looks like record losses for that period.

Hedge Funds Shorting S&P 500 Futures like Mad?

According to acclaimed Bear Doug Kass, the tail might be wagging the dog . Ironically, he has become bullish because he sees excessive shorting of the S&P 500 futures. In his theory, this is being done to hedge against potential losses on long positions that aren't as liquid. Has the world gone mad? Perma bull Jim Cramer has been suggesting that investors sell, sell, sell and perma bear Kass has actually become bullish. Beginning last Monday, I began to see a number of big hedge funds in the S&P 500 futures pit, boldly selling futures to hedge their core long holdings. As the market dropped precipitously on both Friday afternoon and Monday afternoon, they got ever more aggressive -- according to my sources, more aggressive today than at almost any point in a decade or more. This strategy is a classic tactic one sees at panic/capitulation lows as hedge-hoggers sell short what they can sell easily -- the S&P futures market is deep and liquid -- while they retain what they

Stat of the Day: Commodity Costs Down for the Year

According to the guys at Bespoke, the average daily costs for commodities such as gas is now down $0.62 for the year. So the average consumer is now spending less then they were when the year started. Its also down a remarkable $5.39 per day from the peak in July when consumers were spending $4.77 per day more on commodities. That amounts to a lot of extra cash for consumers and should be bullish to financials and retailers as the market normalizes.

Why is everybody selling when Buffett is loading up?

It intrigues me when the greatest investor of our times has been on a buying spree and yet the markets have just had the worst week in 7 years per CNBC. Guess the heard mentality in the financial markets continues to live strong. After all we're just now coming off commodity and real estate bubbles. Why not have an overdone stock market sell off? Below our the highlights of the recent Buffett purchases: 9/19: MidAmerican Energy and Constellation Energy (CEG) reached a definitive merger agreement in which MidAmerican will purchase all of the outstanding shares of Constellation Energy for a cash consideration of approximately $4.7 billion, or $26.50 per share. Berkshire Hathaway (BRKA/BRKB) owns 87.4% of MidAmerican. 9/23: Berkshire Hathaway is paying $5 billion for Goldman Sachs (GS) preferred shares that pay a 10% dividend. Berkshire also gets the right to pay $5 billion more in Goldman common shares at $115 each. 9/29: MidAmerican Energy today announced it has

Stat of the Day: Stocks undervalued by nearly 60%

Image
The IBES valuation model continues to show stocks are very undervalued. The ratio is at record low levels. The current S&P500 yield is at 8.84% while the 10 year treasury note yield is at 3.66%. The fear is so great that people continue to favor low yielding notes for much higher yielding stocks. Very interesting to note that the market is at the exact inverse of the 2000 peak. At that peak in 2000 the market was 60% overvalued. Since then though, the market has consistently been undervalued partly because people preferred to invest in real estate over the last 5 years and the stock market crash in 2000 scared people away from the market. Once stability returns to the markets, stocks should be in for a long run. This valuation model should return to the even mark at some point in the future.

Buffett continues to buy up distressed stocks

Today we get news that Buffett's bank - Wells Fargo (WFC)- has bought Wachovia (WB) swooping in and taking them away from Citigroup (C). Buffett is betting big on the rescue plan to be voted on in the House today. Recently he has bought stakes in GS, GE, and CEG. If Buffett is loading up, should you be sitting on the sidelines? Great interview with Buffett talking about the rescue plan and his recent investments. Buffett continues to be the ultimate buy low, sell high investor. He continues to be positive that the rescue plan will be profitable.

Launch of Hedged Growth Portfolio

As of 10/1, I'm officially adding the Hedged Growth portolio as an option for clients. This portfolio will be the a combination of my existing Growth and Net Payout Yield portfolios plus a combination of shorts. Ideally the portfolio will include a combination of 1/3 of each component. So 1/3 of the stable New Payout Yield stocks, 1/3 of the Growth stocks, and 1/3 Shorts. This will ideally provide a less volatile portfolio that provides more consitent returns regardless of the markets. The Net Payout Yield stocks will provide steady, market beating returns while the Growth and Short sections will provide a market neutral approach with the best of both options. While the Net Payout stocks will be fully invested, the Growth and Shorts will be tweaked depending on the markets with neither to exceed the 33% threshold. Starting today I've set up fund SFCHG at Marketocracy to start a model portfolio. The expenses on this fund at 2% will be higher then I'd charge clients, but thi

Stat of the Day: DOW has rare 4 straight quarters of losses

Its been since the 70s that the DOW has had 4 staright quarters of losses. Here are some other stats from CNBC showing how bad the world markets have been since the highs of last year. The Russell 2000 has been the best performing index with only a 22% loss. China with it's 62% loss has made our losses seem rather small. Guess it's all about your perspective in this market. With todays start, the market is headed towards a 5th straight quarter of negative returns. If 4 negative quarters haven't happend in 40 years, makes me wonder how long its been since we've seen 5 negatives.

Mark to Market Accounting Clarification from the SEC

Reuters reports No need for Fire Sale Pricing which very possibly would've saved Wachovia Bank (WB). The substantial marks taken by JPM on the WM loans all but doomed WB. Now the SEC claims that a distressed sell wouldn't be classied as a market between willing parties and wouldn't count as a 'market'. U.S. securities regulators provided initial guidance on fair value accounting and reminded financial services firms that they don't need to use fire sale prices when evaluating their hard to price assets, according to a document first obtained by Reuters on Tuesday. U.S. accounting rule makers assume that fair value inputs are based on an orderly transaction between willing market participants. The SEC release indicated that the agency does not believe distressed, or forced liquidation sales are orderly transactions. The SEC's guidance says that sometimes the level 3 inputs may be more appropriate than the so-called level 2 or observable inputs. This is a goo

Stat of the Day: Money Market Assets at Record Levels

Image
As of last week according to http://www.sentimentrader.com/ , money market assets alone would amount to 27% of the value of the S&P500. This almost doubles the last housing crisis in the early '90s of 14%. It's also considerablely higher then the 22% reached after 9/11. In fact, after yesterdays historic drop we're likely over 30% now. All of these assets will have to leave the bomb shelter at some point.

Poll of the Day: Was the House correct to not pass the bailout bill?

It's interesting that as the day closes this Smartmoney.com poll is actually very close to 50/50. We've been led to believe over the last few days that 100:1 of constituents for these House members involved in this vote are against the bill. Ironically this poll tells a different story. CNBC.com also had a poll that earlier today actually showed more people in favor of passing the bill. With CNBC having more of hardcore investor following, I find the Smartmoney.com poll more compelling and reflective of the general population. Goes to show that people for a bill aren't as likely to complain. Or just maybe a lot of people changed their mind today after seeing the market reaction. With the markets being the ultimate real time polling mechanisms, just maybe we'll see a re-drafted bill approved. After all, these polls suggest the House members voting for the bill won't be in such bad shape come voting time after all. Edit: The poll ended up at 46% for the bill. Maybe

Stat of the Day II: Bonds fall more then equities

In what was a miserable day in the stock market, bonds fell even farther. While the S&P 500 fell 8.8% the index of investment grade corporate bonds (LQD) fell an astonishing 9.4%. Now who holds a lot of bonds...hmm. Let me guess that a lot of retirees might be a little disturbed to see their bond holdings decimated. Weren't we told this wouldn't impact Main Street. My guess is that a lot of people begin to change their tunes on this rescue plan. It clearly impacts everybody. See the chart at Bespoke, Bespoke - Corporate Bonds . Lots of more once in a century stats if I had the time to post.

Stat of the Day: VXO hits 45 again

Not hardly a week removed from hitting 45 on 9/18/08 and the market is back to this extreme level. Usually hitting the 40 level has historically been a huge buy signal for at least the next 4-6 months. Below are the times that 40 has been hit and only 2 times did it exceed 45 in the prior 20+ years until this month. Guess time will tell if this one leads to a huge rally. Date High 10/19/1987 152.48 8/24/1990 40.01 10/27/1997 40.04 8/27/1998 41.46 4/14/2000 41.53 3/22/2001 41.99 9/17/2001 47.7 7/11/2002 41.64 9/18/2008 45.81

The Money Making Bailout

It seems very ironic to me that while most of the media and politicians keep harping about the size and scope of the 'Bailout' proposal, alot of well respected investment pros continue to harp on how this deal would potentially be profitable to taxpayers. So while certain politicians want to protect the taxpayer, they are actually just pandering to the uninformed or at least thats what their doing according to these people. Andy Kessler wrote the follow in the WSJ Mother of all Trades My analysis suggests that Treasury Secretary Henry Paulson (a former investment banker, no less, not a trader) may pull off the mother of all trades, which could net a trillion dollars and maybe as much as $2.2 trillion -- yes, with a "t" -- for the United States Treasury. You can slice the numbers a lot of different ways. My calculations, which assume 50% impairment on subprime loans, suggest it is possible, all in, for this portfolio to generate between $1 trillion and $2.2 trillion -

Net Payout Yield Focus: Boeing (BA)

Another day, another drubbing for Boeing ( BA ). BA is now down 47% from its 52 week high due to plane delays, machinist strike, and a weak overall market. All of this is good news for somebody wanting a high yielding stock. BA has been buying back stock at a rampant pace of late. Over the last 12 months, BA has bought back nearly $4B of stock with a current market cap of just over $42B. This gives BA a buyback yield of nearly 9%. Add on the 2.7% dividend and you get a net payout yield of nearly 12%. This yield is incredible considering the market position and financial strength that BA claims. It's possible the strike goes on longer than expected and causes huge financial disruptions to BA, or maybe the global growth story will continue to erode and plane order will be canceled and pushed out. Regardless, BA has the financial strength to outlast the issues and will continue to buyback stock at these lower levels and issue a nice dividend. The longer the stock remains this low, the

Net Payout Yield Focus - Microsoft (MSFT)

Yesterday, Microsoft ( MSFT ) announced a significant share purchase program and an increase to the quarterly dividend. MSFT was up 1% yesterday during a horrible market providing a relative gain against the market of 480 basis points. Very impressive, considering that MSFT didn't annonce better results or a revolutionary product. It was all because MSFT has the financial liquidity to make shareholder friendly moves. This is one of the reasons a net payout yield portfolio can be very attractive. Lets analyze what MSFT announced: Declared a quarterly dividend of $0.13 per share, reflecting a two cent or 18 percent increase over the previous quarter's dividend. Approved a new share repurchase program authorizing up to an additional $40 billion in share repurchases with an expiration of September 30, 2013. Authorized debt financings from time to time of up to $6 billion. Pursuant to the authorization, the company has established a $2 billion commercial paper program. The increase

The Advantage of Net Payout Yields

The Dogs of the Dow Theory has long interested me in its simplistic nature of eliminating the emotion of the stock market and systematically investing in the out of favor or contrarian stock. What least interested me was that an investor was suppose to buy the 10 highest yielding stocks amongst the 30 stocks in the Dow Jones Industrial average on presumably January 1st and hold them for a year. While this compelled to my ‘lazy’ nature and was tax beneficial, it seemed overly simplistic and too focused on larger stocks that underperform smaller stocks in the long run. Why not adjust on a monthly if not daily basis? Or buy smaller stocks? If Pfizer ( PFE ) increases 50% by June and the yield consequently shrinks below the top 10 yields why continue holding till January and potentially give back that gain. Another compelling concept was to extend the selection beyond the Dow and into the S&P 500 where more growth exists and the selection widens. For this method to work, the underlying