Posts

Showing posts from 2009

IB Net Payout Yields Model

Buy & Hold for the Next Decade

Interesting discussion with Vince Farrell about how the Buy & Hold method might have been the wrong strategy in the last decade, but it likely could thrive in the next decade. IMO, anytime a theory is supposedly dead is the time to start using it again. Though I'll say that Buy & Hold as a theory really only works when discussing Mutual Fund investing or ETF indexes. The successful funds never remain with the same stocks and rarely does keeping an individual stock over a extended period profitable. The stock market consistently misprices assets whether too high or low. A good investor will take advantage and switch from the high prices to the low prices stock. Considering the last 10 years was the worst decade for holding stocks, it's only logical that the next 10 years should be strong. You'll note that most people don't agree as they've been rushing into bond funds at record levels. By the way, Energy was the best performing sector up some 600% last decade

LIZ Gets a Good Plug

Image
Arne Alsin on RealMoney.com plugged Liz Claiborne (LIZ) in his Top 10 Stocks for 2010 predictions. He like Stone Fox Capital has been bullish on LIZ for the last several months. We thought back in October when LIZ broke above $7 that our target of over $10 and hopefully $15 might be reached sooner then expected but then LIZ swooned unexpectedly back into the $4s. Now LIZ is again breaking above the 200EMA and looks like a solid breakout stock for Q1 2010. Its over extended today, but we'd buy on any pullbacks to the 200EMA as the 20 & 50EMAs surpass the 200EMA back at $5.25. Liz Claiborne ( LIZ Quote ) : Nothing has changed since I recommended apparel maker Liz Claiborne earlier this year at $4.38 per share, and again on Sept. 16 at $6.27. With the stock trading at $4.37, it's an easy pick for the top 10 list. The company is worth far more than its current market cap of $380 million. By this time next year, the earnings power of this company will become evident. With $3 bi

Trade: Sold US Steel

Just trimmed our position in US Steel (X) in the Growth Portfolio by 400 shares or about 40% of our position. Mainly just a trading move as X has become extended trading at roughly 20% over the 20EMA and the 14 day RSI is at 82. Numbers that usually alert to near term tops. We'll look to add back this position around the 20EMA currently at $49.50.

Performance Review: Growth Portfolio Looks to Close out 2009 with 75%+ Gains

2009 has been a phenomenal year in the market in has gains in the SP500 look to succeed 25%. Our Growth Portfolio is on the pace for a 78% gain if the market closes at these levels with only 4 trading days left. That's easily going to be 50% points greater then the market. A remarkable year after such a weak start going into March. Also, the annualized gain should finish the year around 12.5% after 18 months of performance. Not too shabby for a very wild time period. Our biggest holding is Apple ( AAPL ) and it closed out last week with an all time high over $209. Its bounce back from the $80s along with other big moves in large holding like the Hartford Financial ( HIG ), US Steel (X), and Freeport McMoran ( FCX ) not only shows the explosive growth in the market but also the different sectors and hence the reduced risk not being totally reliant on just commodities or financials like alot of top portfolios. For 2010, we still see decent gains in the market as the melt up con

SP 400 Mid Cap Index Hits New Highs

Image
Today the SP 400 Mid Cap Index closed at new highs for this rally signaling that a breakout in the overall market is likely at hand. This index holds the market changing stocks of the US economy and any move higher is a likely indication of what the SP500 and DOW will do in the weeks and months to come. The Russell 2000 is making a move towards its highs as well closing at 618 within range of its highs just 1% higher around 625. The risk trade is apparently back on after being off for the last 2 months. SP 400 Mid Cap Index Russell 2000 Index

Can Terex Focus Its Way to Huge Profits?

Terex is one of the largest builders of Construction and Mining equipment in the world. Late Sunday night they announced a deal to sell their mining equipment business to Bucyrus (BUCY). According to management, this deal for $1.3B in cash (or potentially $300M in BUCY stock) allows for TEX to focus on the Crane, Aerial Work Platform, Construction, and Materials Processing sectors. It also provides TEX with much needed liquidity in this liquidity strained market. The deal transfers about 20% in sales or roughly $1B from 2009 totals, but only 15% of sales back in the boom times of 2008. The mining segment was also requiring over 20% of working capital expenditures even though in normal times it doesn't produce more then 15% of revenues. On the Conference Call this morning to discuss the deal, the CEO announced that TEX has a goal to double revenues to roughly the $8B level and EPS to $6 by 2013. Impressive numbers for a $20 stock with a $2.2B market cap if they can achieve those n

Future Stat of the Week: Earnings to Rise 52 Percent by 2011

While reading through this Bloomberg article on the record prices for M&A deals, I uncovered the little nugget that analysts now expect 2011 earnings of S&P500 stocks to reach nearly $95. Considering before the crash those corporations were making roughly $100, the economy is expected to bounce back much more then the headlines we see every day suggest. In fact, if you look at any stock you own that wasn't crippled by the crisis, you should expect its stock price to reach back to its highs back at the peak. Heck, the momentum of 2 years where earnings grow on aggregate by 52% would probably be enough to force stocks above those highs. At Stone Fox Capital, we've remained very bullish, but this is probably beyond where we expected the economy to be and this is the average analyst not the outlier. This definitely bodes well for our 'melt up' theory. Back to the M&A premiums as that news is almost as astonishing as the earnings picture. Paying record premiums

Bearish Bernstien Becomes Berry Bullish

Image
Ok, that's my best attempt at being creative. Richard Bernstien appeared on Fast Money last night to talk about some of his bullish calls for 2010. I'll take their word for his bearish stance earlier this year, but I'm not sure all of his calls are so bullish. At least, he is more bullish now and we're agreeable with that switch. Stone Fox Capital definitely agrees with the points that stocks will be positive because of higher profits and that small caps are likely to outperform. We're not so agreeable that the dollar will rally and end the carry trade with the massive government spending and debt planned. Below we give out opinions of his points. 1. Stock and bond market returns in the US will again be positive. 2. The US dollar is likely to meaningfully appreciate once market-driven short-term rates begin to rise. [ When they do rise it'll be long after most other countries and the rate will be much lower. We just don't see the dollar rising against mos

Joy Global Bullish on China & India Coal Demand

Joy Global (JOYG) has one of the more detailed earnings reports especially regarding end user demand for commodities like copper and coal that we favor as being in short supply because of the booming demand in China and now apparently India. The coal import demand from these 2 countries could be just staggering in the next few years. While copper could be in short supply in 2011 has industrialized countries return to stronger demand at the same time that China uses more and more. Everything points to higher commodity prices then the peak prices in 2008. See below for the outlook from JOYG. Market Outlook Demand for mined commodities continues to be dominated by strong imports from the emerging markets, and from China and India in particular, with improving but still weak fundamentals from the industrialized countries. For the past year, China has been the major source of increased demand for commodities as it deployed a more effective stimulus program and

Future Stat of the Week: Leading Economic Indicators

Ok these numbers have already been reported earlier today. If time permitted, we would have talked earlier this week about how the expectations were for a 0.7% increase in the leading indicators and nearly a 10% annual growth rate. With all the noise in the market, its important to step back and reflect on how positive these numbers are for the economy. All the worries about the dollar and this and that are just non sense noise. On to the report since we have it already. The Conference Board reported today that the leading indicators actually increased by 0.9%. This was above the expectations of 0.7% as mentioned earlier. The 6 month growth rate is now 4.7% or a 9.4% annual rate. Just slightly below the 5% numbers reported the last 2 months. The interest rate spread ( what we've harked on for a while ), Average weekly jobless claims, Average workweek, building permits, and stock prices continue to remain very positive. Easily off setting the declines in supplier deliveries and con

China Power Consumption Soars 28% YOY

Image
Demand for energy in China has begun to really surge. For November, electricity demand is up nearly 28% over last year. Not following China energy demands in the past its difficult to tell the importance of the Year over Year (YOY) versus the month over month numbers or even compared to August. China's land mass is vaguely on par with the same distance from the equator as US so if on can assume the same temperatures then this is a powerful number. August is a high air conditioner month and November is typically cool, but not cold enough for massive heat needs. Even assuming that the world stood still for a while in November, the massive 28% increase is amazing. China appears to be kicking its growth engine into full speed. If the US ever gets back to demanding higher amounts of coal, copper, oil and other commodities, prices could soar. Everybody seems to forget that the last surge in commodities happened while the US had declining demand for copper and to a lessor extend coal and

Avoid Bonds!

Cramer seems to be backing our Net Payout Yield Portfolio. Retail investors continue to push massive amounts of money into bond funds instead of stock funds. As Cramer suggests, this isn't prudent with the government continuing to dilute the market with massive issuance now and in the future. The better option is clearly high paying dividend stocks which the Net Payout Yield Portfolio is loaded up with. Check out our performance at marketocracy.com . Then watch the clip and move your money into our portfolio or a similar one.

Transports Make a Bullish Break

Image
Its long been known on Wall Street that Transport typically lead market breakouts. Today the Transport Index broke above recent resistance around the 4100 level and signaled a clear breakout. More from FundMyMutualFund on this subject. It clearly supports our case that the market is about to breakout of a range between the 1,085 and 1,110 on the S&P500 that its been stuck in for the last 5 weeks or so. A clear move in any direction after such a consolidation will likely be very powerful. Possibly running all the way to 1,200 before stopping. Confirmation tomorrow will be key. As you can see from the below chart, the SP500 has made a clear new high close and any run tomorrow could easily post a new intraday high as well signaling a clear breakout following the Transports. A close above 1,120 sinalling the all clear for computer programs and hedge funds.

JPMorgan says World Economy Reaching 'Curising Speed'

Image
Not really that surprising as countries like China and India are doing exceptionally well and the US is catching up. The other comment on earnings reaching $80 on the S&P500 next year surprised us. The market only trades at a PE of 13.7 making it suddenly cheap. How many go on TV claiming this market is the most over valued in a long time? Corporate profits have been a lot stronger then most expected. Just think, at the start of 2009 the US was in the worst economy since the Great Depression and yet before the year is over SP500 profits are back to $80. Thats incredible! “Equity markets should rise again next year driven by strong earnings growth. Our $80 S&P 500 EPS forecast for 2010 is 27% higher than this year’s $63, implying a much faster rise in earnings than nominal GDP, i.e., an expansion in profit margins. Our forecast suggests that by the end of next year, US profit margins are likely to approach the historic highs reached earlier this decade.” This earnings assumpti

Yield Curve, Yield Curve, Yield Curve

As we've touched on several times in the past, the Yield Curve or the difference between the 10 Yr Treasury and the 90 Day is very predictive of future economic growth. A wide difference in yields of 2% of more is usually very conducive to growth while a flat to negative yield curve signals tough times ahead - credit is restricted at those levels. Bloomberg had an article today about the Yield Curve being the highest since 1992. Now they use the difference between the 30 Yr and the 2 Yr securities, but it's still the same philosophy with different versions of long term versus short term yields. No matter which version you use, when the Yield Curve is 368 basis points banks are literally printing money by borrowing it for next to nothing and lending it at much higher rates. Just think how your savings account pays next to nothing, but a 30 year mortgage is around 5%. One major problem though is that banks are having a hard time finding qualified borrowers of that cheap cash. A

Investors Continue to Plow into Money Market Funds

It's very perplexing to us why investors would plow money into money market funds. This report suggests that $13B was transferred into these funds yielding 0.03 percent. Considering that many a dividend paying stock like Verizon (VZ) or even Bristol Meyers (BMY) have yields in the 4-6% range its difficult to grasp why somebody is willing to accept nothing. Assume this move goes back to the Dubai scare or even Greece. Either way, until this money comes flooding in the US stock market its difficult to see any push to a top. Taxable money market fund assets rose by $10.4 billion to $2.88 trillion, while tax-free assets rose by $2.6 billion to $408.7 billion, according to the report, published by iMoneyNet. Yields on taxable money market funds held at a record low of 0.03 percent for a third consecutive week. Tax-free and municipal money-market fund yields set a fresh all-time low of 0.03 percent, down from 0.04 percent a week ago.

U.S. Steel Breaking Out

Image
After what as been a weak last 4-5 days in the materials sector, its interesting to see that U.S. Steel (X) closed at recent highs. Some bullish news from the demand in China helped. Now X did trade at around $50 back in September so that will be the next resistance area before we have a major breakout. Its important to remember that X traded at $180 last year so its still some 60% below that high. X is one of our larger holdings in the Growth Portfolio. 2:07PM U.S. Steel notches a fresh session high of 46.30, hovering slightly under its Dec/two month high at 46.40 ( X ) 46.27 +2.04 : (closed at 46.74)

Local.com Ups Guidance Yet Again

Local.com (LOCM), a leading local search company, upped guidance today from a 2% sequential gain to an 8% sequential gain. Revenue is expected to be in the range of $16.4M and adjusted earnings in the $.10 to .12 range. All from a stock just trading above $5 before the announcement. The earnings run rate is now on a $.40+ level with expectations for at least 24% revenue growth next year. Analyst still report earnings on a GAAP basis which is bizarre for a small tech company. Since the average analyst expects GAAP eps to grow by $.30 in 2010, we feel comfortable that adjusted net income could easily top $.70 on a conservative basis. Slap at least a 20 PE on that estimate and the stock zooms to $14 from the current high $5s. New Guidance The company now expects total revenue for the fourth quarter to be between $16.2 and $16.6 million, which at the midpoint would represent an 8% sequential increase over the third quarter of 2009. The company expects net income (loss)

UPS to Gain on FedEx Earnings Raise

After the bell, FedEx (FDX) had a huge raise to earnings for Q4. FDX increased earnings to $1.10 for Q4 which was 30% above analyst estimates. With the stock trading with a forward PE of 20 the market clearly saw better then expected earnings on the way, but I seriously doubt this was envisioned. At the same time, earnings are still a lot lower then levels in the prior year. Just goes to show how overly pessimistic stock expectations got when the market hit lows in March. Heck FDX nearly doubled their own low end estimate of $.65. UPS should see a decent gain for our Net Payout Yield and Hedged Growth portfolios. They still sport a 3% dividend yield plus expected stock buybacks making a very attractive investment even with further gains. Significant growth in international markets will be a constant theme that our stock picks will be aligned to take advantage. “FedEx will exceed previous earnings guidance in the second quarter primarily due to better-than-expected growth in FedE

Interest Rates to Remain Low for a Long Time

It's odd to see the fear in the markets that interest rates will rise sooner rather then later. If it does rise, it'll only be because of much better economic data including job expansion. As we've reported [Ultimate Leading Indicator: Yield Curve] , when rates rise from an extremely accommodative level and a high yield curve its bullish for the markets. In theory, rates are exceptionally low due to a very weak economy and the raised rates are due to the economy being much better then expected. That's bullish for stocks. The issue is when rates are extremely high and then they are raised because of inflation fears. So the level of the starting rate is very crucial. According to these 2 guests on CNBC the expectation is for rate increases in August 2010 and even later. That seems absurd considering the sub 1% Fed Funds rate. It also highlights the issue with rate policy change. Too much focus is on the trend (increasing/decreasing) versus the absolute number. Raising the

Rallying on Disbelief

An unusual bullish clip from Tech Ticker. They typically parade out numerous skeptics of the market rally. It is precisely this kind of skepticism that makes Bernie Schaeffer, chairman of Schaeffer's Investment Research , believe the rally still has further to go. Bernie has several points that have backed our belief that the market will continue to rally. Namely, money on the sidelines still aren't moving into cash and investment experts remain negative. His main points for the market moving up from here: The Dumb Money: Through October, equity mutual funds had net outflows of $1.9 billion year to date while bond funds had inflows of about $312 billion, according to the ICI . Furthermore, there's been about $10 billion of inflows into inverse funds that short the market, Schaeffer notes. "It not even that money is not coming off the sidelines - [investors are] betting against the market." Magazine Indicators: In 1982, a Business Week cover declared "The D

Performance Review - Net Payout Yield

The Net Payout Yield Portfolio continues to report strong results. Over the last year, the portfolio is up 11.74% compared to the SP500. The Portfolio is also up nearly 10% YTD. Incredible results with a turnover rate of only 14% over the last year. This portfolio has beaten the SP500 each year over the last 3 years since we began tracking. For that time period, we're up 14.5% versus the market. FYI....only the last 16 months or so are being tracked on marketocracy.com, but the results have been better since we began using their system. Investments in CSX and Agrium (AGU) have been very profitable with gains around 40% since purchases earlier this summer. A solid rally in our biggest investment, Banco Itau (ITUB), has definitely helped results. In general though, the solid dividends and stock buybacks by the stocks we invest in continue to benefit the stocks as the market recovers. Companies that have cash to give to shareholders tend to be much better investments long term. Please

Stat of the Day: Weekly Hours Worked Up 0.2

As everybody scrambles to focus on the total jobs loss or the unemployment rate reported for November this morning, the real key number is the Average Weekly Hours. For November the number increase to 33.2 from 33.0 in October. This is a significant increase and according to reports a 0.1 hour increase is the equivalent to 400K jobs. Not only does it correlate to a ton of more hours worked it also signals that eventually more people will be hired as existing workers are utilized more. Still a lot of slack in the economy, but this is one of the better indications that the jobs market is indeed improving. Overall, just about all the metrics in the jobs report were very bullish: job losses much lower then expected, revisions to previous months up 159K, and workweek increased the most in months. The average workweek, which closely correlates with overall output and gives clues on when firms will start hiring, rose to 33.2 hours from 33 hours in October. That was the highest since February

Stat of the Day: ISM Non Manufacturing Index Slumps

ISM reported this morning a very disappointing number for their November Non Manufacturing Index (NMI) or sevices. The index came in at 48.7 with expectations around 51.5. This number was much weaker then expected and doesn't really jive with other economic reports that have been very bullish such as Initial Jobless Claims that came in much better then expected. Being that the NMI number is very much correlated to sentiment then hard facts, it's possible that emotions were heavily influential in this report. All of the different categories were weaker though New Orders remained relatively strong at 55. The really confounding numbers are that Production was slightly negative at sub 50 and New Orders were up at 55, but somehow Backlog dropped to 48.5. "The NMI (Non-Manufacturing Index) registered 48.7 percent in November, 1.9 percentage points lower than the 50.6 percent registered in October, indicating contraction in the non-manufacturing sector after two consecutive mont

Progess Energy Switching to Natural Gas

Or at least that's the headlines from today's announcement from Progress Energy (PGN). Now as you read the details you'll see that PGN is only moving about 30% of their coal plants to natural gas. Its also interesting to note that its just the old plants and not the modernized plants. And that it won't be until 2013-2014 before the plants really start closing. This news is clearly long term bullish for the natural gas industry and bearish for coal. Though I think alot of expectation already existed that domestically we'll continue to push more into natural gas, solar, and wind. This isn't completely bearish for coal though because places like China and India will continue to heavily rely on coal because that is the resource that they have. Not sure how this impacts Cloud Peak (CLD) and may explain the IPO weakness. Clearly though any impact will only be years away at the earliest. We're currently working on another article that discusses the importance that

Market Melt Up Scenario Remains in Play

Image
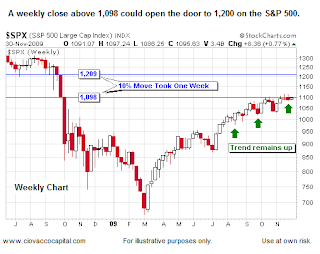
Several months ago Stone Fox Capital suggested that the market could 'Melt Up' in a scenario similar to how it melted down last year. During the span of a few weeks the market quickly dropped from above 1,200 to below 900. When this happens either on the way up or on the way down, it leaves very little resistance when the market revisits those levels in the opposite direction. The market has been stuck around 1,100 for several weeks now so its likely to either move quickly higher to the 1,200+ level or finally have that 10%+ correction that everybody on Wall St wants. The below chart from Ciovacco Capital highlights that potential. It seems unlikely that this surge off the bottom will end in a whimper but rather a blow off top with money rushing in from the sidelines. Since we've highlighted that such huge rallies off a bottom after a major market decline never end at year end and usually last more then a year, it seems unlikely that a correction is pending. The more lik

Stat of the Day: Chicago PMI Surprises to the Upside

Image
While everybody is focused on the relatively small issue in Dubai (it's a lot smaller then AIG after all), the Chicago PMI reported a fantastic number at 56.1 today. New orders remained strong and inventories were weak. Strong combination for future growth. The estimates were around 53 with expectations of a drop from 54.2 last month. So the number was up with expectations for a mild drop. The Chicago PMI number bodes well for the ISM Manufacturing Index to be released on Tuesday and the ISM non-Manufacturing number on Thursday. Highlights Gains in new orders and a slowing in deliveries hightlight November's Chicago purchasers' report, offsetting further losses in employment and further draws in inventories. Chicgao's headline index rose nearly 2 points to 56.1 to indicate a month-to-month increase in the pace of overalll business activity in the area. New orders rose 1.4 points to a very strong 62.8, a plus-60 level that, because of its strength, will be hard to match

Russell 2000 Weakness

Image
Since late September, the Russell 2000 has been particularly weak. The index of small cap stocks made a slightly higher high in mid October, but hasn't come close to the 625 high in November while the S&P500 continues to trade above the Sept/Oct levels. Part of the reason could be that a lot of the smaller cap stocks are more domestic plays and the more international exposure you have the better. Its also been the case that financial stocks such as regional banks have been weak during that period. Regardless its led our Growth Portfolio to underperform the last month after a huge outperformance this year - up nearly 70%. A lot of the smaller investments such as Liz Claiborne (LIZ) have been hit hard after surging. LIZ is down from a high around $7.5 all the way to $4.5. Many other examples exist as well. Hard to explain why the smaller stocks have been so weak with the world economy showing signs of growth. They should do better in a recovering economy. Maybe people were just

Coal Companies Wrongfully Smashed by China Imports Data

Coal companies were hit hard intraday becuase of supposed weak coal import data from China. Guess the data was negative or positive depending on how one viewed it. On one hand the imports were down 11% from September. On the other hand they were up 220% over last year. Apparently the market was looking for a number similar to Septembers. Regardless the YOY gains are enormous and the month to month numbers are bound to fluctuate. The trend still appears for bullish for longs. Companies that we like such as Alpha Natural Resources (ANR) and the new IPO Cloud Peak Energy (CLD) were all hit hard today especially in comparison to the strong gains in the market. ANR was down 5% from its high around the opening bell. U.S. coal mining shares fell on Monday after data showed China's coal imports dropped 11 percent in the last month, even though exporters expect a booming market in the Pacific region for the next few years. Indeed, the latest official Chinese customs data showed coal impo

Atwoods Oceanics Reports Solid Results

Atwoods Oceanics (ATW) as usual posted their normal earnings beat. ATW is a semi deep water focused oil/gas drilling firm. Earnings were down from the solid $1.16 last year, but they did report strong 15% YOY earnings growth for fiscal 2009. Not bad for a stock trading at roughly 10x earnings. Now with oil back around $80, the demand for their services appears to be picking up as evidenced by a couple of recent contracts. Earnings likely bottomed out this Q and analysts expect earnings of at least $4.04 for fiscal 2010. Look for earnings to continue rising with the improved demand environment and new builds on the horizon. 4:59PM Atwood Oceanics beats by $0.06, beats on revs ( ATW ) 37.96 +0.97 : Reports Q4 (Sep) earnings of $0.75 per share, $0.06 better than the First Call consensus of $0.69; revenues fell 18.5% year/year to $131 mln vs the $128.4 mln consensus.

Future Stat of the Week: Weekly Jobless Claims Again

Just two weeks ago, Stone Fox Capital talked about the importance of a weekly jobless claims figure below 500K. The number didn't make it reporting in at 505K (502K originally), but that is where the key of understanding the future is a lot of times more important then the number reported. On Wednesday, the consensus estimate for Weekly Jobless Claims by Bloomberg is 495K. The low estimate is an incredible 460K with the high only 500K which would happen on its own to be a low for this cycle. So while the market sweated the number reported last Thursday, it was without doubt that the next sequence of numbers would be lower and possibly much lower just the next week. Don't fight the trend by sweating weekly nuances. Especially considering we're most likely to see sub-400K numbers before the trend even becomes a question. Released on 11/25/2009 8:30:00 AM For wk11/21, 2009 Prior Consensus Consensus Range

Buying Cloud Peak While it Trades in the Valley

The Cloud Peak Energy IPO (CLD) priced last night at $15 which was below the original range of $16-18. Very perplexing considering the commodities sector and especially coal stocks have been very hot of late. Then Reuters published some analyst comments that made us more bullish. Basically the analysts are concerned that the proceeds are going back to Rio Tinto (RTP) and that the deal was overpriced and coal demand is uncertain. Huh? Are they serious? Why has Peabody Energy (BTU) and Massey Energy (MEE) rallied so hard lately? This really seems like Wall St playing games with a forced seller. RTP needs the money to reduce it's debt load. CLD is clearly not overvalued as both BTU and MEE sport PEs in the 20s while CLD starts in the 7-8 range. If anything CLD is extremely undervalued. Gillette, Wyoming-based Cloud Peak raised about $459 million but almost all of the proceeds will go to Rio Tinto, which will retain a 48.3 percent stake in Cloud Peak. Rio Tinto is saddled with debt st

Remaining Bullish on Sears Holdings After Q3 Earnings

Today, Sears Holdings (SHLD) reported earnings and revenue that beat estimates. Some of the more positive notes were that KMart stores had positive comps and they bought back 3.5M shares. Continuing to shrink the float at a dramatic rate leaving very few shares not owned by strong institutions. SHLD continues to be a very cheap stock compared to the asset base. See our previous posts on the details. Everybody will come out and scream how SHLD is a big short in the $70s because they make limited amounts of money. The PE is too large.... yada, yada, yada. SHLD is extremely cheap. Period! 6:09AM Sears Hldg beats by $0.28, beats on revs ( SHLD ) 75.77 : Reports Q3 (Oct) loss of $0.81 per share, excluding non-recurring items, $0.28 better than the First Call consensus of ($1.09); revenues fell 4.4% year/year to $10.19 bln vs the $9.92 bln consensus. Domestic comparable store sales declined 2.3% in the aggregate for the quarter, and included an increase at Kmart of 0.5%, offset by a decli