Posts

Showing posts from January, 2010

IB Net Payout Yields Model

Financials Default Risk Soars

Image
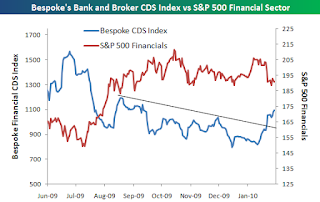
The Bespoke Investment Group has an incredible chart on the dramatic rise in the CDS default risk of financials in the SP500. It's not surprising to see periods of rising default risk as the recovery gathers steam but this is really unexplainable. The Obama/Volker plan is concerning for a small portion of profits but it surely doesn't provide this level of risk to the system. Rather it seems like spoiled 'Wall Street' crowd is using the 'fear' of these new regulations to scare the system into trading profits. After the Brown victory and the healthcare plan defeat, I'm not sure why anybody gives these plans such credence. We all know it'll likely be bogged down in Congress due to its complexity. The VIX also spiked the last couple of weeks. A similar bounce took place in November as well. Will it rollover like November or are we talking about issues similar to 2008 when the VIX spiked in the 80s. Maybe this is related to the so called tightening in China

Legendary Investor Bill Miller Sees Values Hidden in Plain Sight

Bill Miller is the legendary investor from Legg Mason Capital Management that beat the SP500 for 15 straight years (CNBC claims it was a record) before the financial crisis just about destroyed Legg Mason and his reputation. Bill has basically been in the investment wilderness for the last couple of years as the doom and gloomers took over the media. Recently he appeared on CNBC (see video below) and penned this interesting commentary for January. One of the biggest issues I've noticed with Bill is that he seems clearly focused on just US stocks. He wasn't a big investor in commodities in the 2000s which is what lead to his under performance. Now after a good 2009 he seems to be regaining some of the spotlight so it's interesting to see what he says now especially since Stone Fox Capital has similar views in valuing assets and the stock market. Like us he seems clearly more bullish on profit growth and higher GDP then the general market expects. Anybody watching CNBC will

Regions Financial Builds Provisions Again

Regions Financial (RF) is one of the smaller holdings in our Growth Portfolio, but its worth following considering its proximity to the important housing markets in Florida and Atlanta. RF reported 'disappointing' results this morning causing the stock to plummet over 7% today. Earnings were indeed lower then expected (.46 vs .35), but it was largely driven by a large build in provisions and not chargeoffs. In fact, provisions exceeded chargeoffs by $487M or nearly 40% of the $1.2B provision was to build for future write offs. That seems excessive considering the stage in this credit cycle and considering that gross inflows of non-performing assets declined for the second consecutive quarter. If we had to guess, this would appear to be the peak loan provision Q. Hence, future quarters will see declining costs. Its possible this was the kitchen sink Q making 2010 much cleaner. Time will tell but the regional banks appear alot more attractive now. They aren't on the target li

Trade: Bought UltraShort Real Estate

Based on the weakness in the stock market from Obamamania and China banking restrictions, we bought some protection for the Growth and Hedged Growth portfolio today. The UltraShort Real Estate (SRS) was the selection for this hedge. Assuming the market craters thru strong resistance in the 1,085 level, SRS should see huge gains. In addition, the constant slamming of the banking system by Obama should help doom this industry as banks slow lending and commercial real estate companies lose the ability to roll over massive amounts of debt. Now we're not completely set that the market is about to rollover, but SRS should provide us some protection in case it happens especially with the timing of the Obama State of the Union speech Wednesday night. This trade will likely only be kept for the week unless the situation changes.

Trade: Sold U.S. Steel

U.S. Steel (X) reported a dismal Q today. Revenue handily beat estimates ($3.4B vs $3.1B) yet earnings missed consensus numbers. All while competitors Nucor (NUE) and AK Steel (AKS) both easily beat number and reported profits. If that wasn't discouraging enough, X forecast that Q1 would be similar to Q4 while analysts (us too) expected a much improved number. Evidently input costs such as coking coal have increased much more then prices. This could be partially because of the demand in China. All in all, this tells us to stay with the Alpha Natural Resources (ANR) and the new pick in Puda Coal (PUDA). The coking coal companies seem able to benefit from the rising demand without the rising supply. Key line from the report: "We expect to report an overall first-quarter 2010 operating loss in line with the fourth-quarter 2009 as gradually improving business conditions are not yet fully reflected in our operating results," said Chairman and Chief Executive Officer John Surma

Fears Overblown?

Wow... What a difference a couple of days can make. On Tuesday, the SP500 closed above 1,150 signaling a potential breakout to 1,200-1,250. Then Republican Scott Brown won the Senate seat in very Democratic MA suggesting that the market would see the breakout rally. Guess what? At the same time that Brown was giving his acceptance speech, news was leaking in China that some banks were requested to stop lending for the remaining of January. Any since China seems to rule the world economy and not the US anymore, the market got spooked an so after 2 trading days the SP500 is barely above 1,115. Now its on the verge of a breakdown signaling the possible correction is finally here. Its seems that everybody is already on board with the drop so that gives me hope that we'll pull out of this tailspin. Pisani has a good article on CNBC regarding the issues: Oh, calm down. Worries about an imminent correction are a bit overblown, at least at this point. The S&P 500 hit a 15-month high o

Future Stat of the Week: Leading Economic Indicators to Soar Again

If we've had one theme since starting this blog, its that the leading economic indicators and its primary leader over the last 12 months, the yield curve, is completely thrown aside by most economists and market experts. It shouldn't be though as it continues to forecast a strong recovery. You can fret about a double dip recession all you want, but it isn't going to happen while the LEI and the yield curve is this positive. So why invest for the correction if the signal isn't pointing that way? Anybody following these indicators should know that the yield curve expanded to record levels recently and hence it should be no surprise that the LEI for December expanded at a fast clip yet again. Initial jobless claims also will juice the number. Economists expect a 0.7% rise after 0.9% in November. Two very solid gains. Market Consensus Before Announcement ( Bloomberg ) The Conference Board's index of leading indicators rose a strong 0.9 percent in November, following a

JPMorgan Results were Stellar

The market might have sold off today 'due' to the results at JPMorgan (JPM) and the fears of higher credit costs, but if anything it was a buy the rumor and sell the news. Or maybe just the media reporting the results in such a negative way that it scared the market. We'd bet that come Tuesday, all the buyers will be back as they realize that JPM could easily earn $3.5 next year making the stock clearly cheap. JPM reported net income of $3.3B or $.74 per share easily beating the $.61 estimates. Revenue was lower then expected, but that's nothing to get excited about in this recovery. Earnings rule revenue any time of the day. They beat estimates by 20% after all but that got quickly brushed aside. reported fourth-quarter 2009 net income of $3.3 billion, compared with net income of $702 million in the fourth quarter of 2008. Earnings per share were $0.74, compared with $0.06 in the fourth quarter of 2008. For the full year of 2009, net income was $11.7 billion, or $2.26

Trade: Bought Puda Coal

Bought less then a 1% position in Puda Coal (PUDA) in the Growth Portfolio. PUDA is a Chinese company and a play on the ever expanding demand for coal in China. It's also a play on the coal consolidation project going on in China where they are in the process of taking over 8 mines and expanding the output. Will likely add more shares if the stock holds at support. A full write up on this investment to follow later this week.

Trade: Sold Portion of Baidu

A little late reporting this sale, but we sold another 25% of the Baidu (BIDU) shares we owned in Growth and Hedged Growth portfolios on the opening Monday. The reason was posted over on my covester.com page . That account sold all of its shares in the after hours on Friday. To some extent i got lucky from reading of the COO resignation after the close and thinking it happened after hours. Guess it is better to be lucky then good as BIDU is down $17 since those trades were made. Losing the COO is still negative regardless of the timing. It's never a good sign when the COO resigns especially on a Friday after the market close. I'm surprised that BIDU didn't trade down, but it's likely that all of the influential traders were gone when the news hit. In addition, BIDU is technically on the verge of breaking down so it was only prudent to exit this position before the market clues in to the news. Its very possible that the conversion to the new software hasn't gone very

Hartford Financial 'Surprises' on Earnings

Image
Or at least that's the headlines and synopsis of the day regarding Hartford Financial (HIG). HIG has now easily surpassed estimates for the 3rd quarter in a row. The analysts estimates for Q4 were around $.80 and HIG now expects something in the range of $1.45 to $1.60 per share. Doubling of estimates is nearly similar to what they reported in the last 2 quarters and the earnings will be in the same range as last quarters $1.56. Hard to understand why the model was so low even with HIG management providing such hideous guidance in the $.70 range. Don't analysts get that HIG was being overly conservative. HIG has now posted over $5 in earnings for just 3 quarters and over the last 2 quarters is on a anual run rate of roughly $6. Book value is quickly approaching the $40 range. So you'd probably guess that HIG trades around $40-50 wouldn't you? If so, you'd be wrong by nearly a mile as HIG barely cracks $28 today. Sure they still have to pay back TARP funds, but at t

Fund Manager of the Year Remains Bullish on Sears Holdings

Sears Holdings (SHLD) remains one of the most debated stocks in the universe of investing. Shorts claim that the PE is too high. Longs (like Stone Fox Capital) claim that the assets (those on and off the balance sheet) are so valuable that the stock is very cheap. Who is right? In situations like this its key to research the involvement of bigger investors. Would you short a stock that Buffet is buying or buy a stock that Buffett is selling? The main investors in SHLD are Eddie Lampert whose ESL hedge fund via RBS Partners owns a whopping 57% or 66M shares and Bruce Berkowitz's Fairholme Funds that owns 13% or 15M shares. It is the 2nd largest holding in his fund. The fund has done so well that Berkowitz was just named the Morningstar Domestic Fund Manager of the Year. Both are guys that investors should be happy to invest along side. Ironically though SHLD has a ton of shorts. In the below interview on CNBC today, Bruce was gleaming from ear to ear on his SHLD investment. Today th

Almost Perfect Risk Adjusted Return for Growth Portfolio

Image
This month has been beautiful so far, but today was almost perfect. The Growth Portfolio made a 1.29% gain while the market was basically flat. Heck the Russell 2000 and the Nasdaq were both down. This portfolio made more today in a flat market then most people piled into short term treasuries will make in years. Just hope I haven't jinxed the trade the rest of the week. Beating Today MTD QTD YTD SFCG 1.29% 4.60% 4.60% 4.60% S&P 500 0.05% 1.93% 1.93% 1.93% DOW 0.02% 1.38% 1.38% 1.38% Nasdaq -0.33% 1.74% 1.74% 1.74%

Cloud Peak Energy Surges on Contract Cancellation

That might sound counter intuitive especially considering that the utility canceling the contract was just about all of the 2011 and 2012 production for the Decker Coal partnership. As I'm writing this, Cloud Peak Energy (CLD) is up 6% to a a new high of $16+. Stone Fox Capital was very bullish on this IPO even after it cratered into the $13s from a original expected range of $16-18. [Buy Cloud Peak Energy as it Trades in the Valley] This was mainly due to this expected contract cancellation with an eastern utility company. Of course on face value it seems bad that the only customer of this partnership would cancel services (ok its a buyout), but in reality in the commodities sector its all about the resources and not the contracts. In fact, the lack of a contract can be beneficial as prices continue to soar and your able to sell into the spot market. Coal might not have a big spot market, but places like China are cutting electricity use due to a lack of coal supplies. You tellin

Future Stat of the Week: ISM Non-Maufacturing to Show Growth

While all eyes will be on the Jobs report on Friday, the Non-Manufacturing Index will likely show a return to growth after a dip in November according to Bloomberg . The Jobs report on the other hand is expected to come in around -1K which could easily hop over to the positive column. That would probably cause some excitement, but I think having the ISM service report hit over 50 (the estimate is 50.5) and possibly the highest for the recovery would be crucial to signaling this recovery is for real. Till December, the recovery has been all about the rebound in Manufacturing caused by the global recovery in places like Asia. Now if the service sector hits full stride we'll definitely start looking for that strong 4%+ economy. Something that's not in the market yet. Market Consensus Before Announcement The composite index from the ISM non-manufacturing survey weakened in November, declining nearly 2 points to a sub-50 and sub-par 48.7. This composite had been marginally positive

Sears Holdings is Off to the Races

Image
Sears Holdings (SHLD) is one of the most hated retails stocks, but if anybody has followed this blog they'd know that SHLD isn't a retail stock. Buy it for the assets that aren't fully accounted for on their balance sheet. Today is broken near term resistance in the $86-88 range. Sure looks like $100 is the next stop around the Oct 2008 highs and then likely much higher. SHLD remains one of our top value picks (read opportunistic) in the Growth Portfolio and a selection for the Net Payout Yield Portfolio because they buyback so much stock. 11:05AM Sears Hldg extends current intraday strength of its morning lows up to last week's December peak of 86.53 ( SHLD ) 56.00 +2.58

Poll of the Day: Double Dip Recession?

Calculated Risk had an interesting poll over the weekend showing how pessimistic people remain. Over 57% of people that voted in the poll expect a double dip recession which appears absurdly pessimistic at this point in the recovery. The only likely scenario to cause a double dip would be massive tightening from the FED. Until that happens, it doesn't seem logical to invest with that expectation. Now I think Calculated Risk is typical for internet blogs in that they tend to bring out the pessimistic people. This ratio though is off the chart. Only 2% expect a GDP growth of over 4% for next year completely going against history of substantial growth in years following serious recessions. Is that because the last 2 recessions were very weak on historical norms so people are expecting a repeat of recent norms? Or are the facts really suggesting an economy with sub par growth? Seems that the facts suggest a 4% growth so we don't really comprehend the rational for such negativity.

Performance Review: 2009

Net Payout Yields RETURNS Last Week -0.76% Last Month 0.64% Last 3 Months 12.15% Last 6 Months 31.76% Last 12 Months 35.38% Last 2 Years N/A Last 3 Years N/A Last 5 Years N/A Since Inception 1.26% (Annualized) 0.89% S&P500 RETURNS Last Week -0.97% Last Month 0.71% Last 3 Months 9.33% Last 6 Months 25.70% Last 12 Months 26.47% Last 2 Years N/A Last 3 Years N/A Last 5 Years N/A Since Inception -8.27% (Annualized) -5.90% RETURNS VS S&P500 Last Week 0.21% Last Month -0.07% Last 3 Months 2.82% Last 6 Mo