Posts

Showing posts with the label GS

IB Net Payout Yields Model

The New Dogs Of The Dow - Q2 2015

Summary The New Dogs of the Dow had Q2 returns that exceeded the gains of the DJIA, but it failed to match the rebound of the Dogs of Dow theory. The average stock in the Net Payout Yields based list has a yield of 8.3% starting Q3. After a large loss in Q2, Travelers tops the list with a 12.3% yield.    This article will focus on the quarterly returns and changes in the new "Dogs of the Dow" strategy originally introduced (see The New Dogs Of The Dow - 2015 ) back in January. The goal of the series is to highlight that the old theory of buying the Dow stocks with the highest dividend yields is outdated. The more modern version involves using the Net Payout Yield (NPY) that adds the net stock buyback yield to the dividend yield. This yield more accurately reflects the modern corporate structure that utilizes a large amount of stock buybacks. Read the full article on Seeking Alpha .   Disclosure: Long AAPL, CAT, IBM, T...
Goldman Sachs: How To Play The Mysterious Capital Return Plan

Summary Goldman Sachs had to resubmit the capital return plan, leaving a lot unknown about the approved stock buyback plan. The investment bank hiked the dividend by $0.05 to a yield of 1.4%. Investors should pay less attention to the stock buyback plan and more attention to the cheap valuation. Of all the major financial institutions, Goldman Sachs (NYSE: GS ) is the one that doesn't disclose the stock buyback plan approved after the Comprehensive Capital Analysis and Review, or CCAR. Though passing the stress test, the investment bank had to revise its capital return plan, leaving most analysts questioning whether it will reduce the stock repurchase amounts of the last couple of years. Read the full article at Seeking Alpha. Disclosure: No positions mentioned. Please review the disclaimer page for more details. 

Update: Goldman Sachs Reports Q4'14 Earnings

Summary Goldman Sachs reported Q4'14 earnings. The stock remains a Strong Buy. The original investment theory of solid yields and huge earnings remains intact.          After the weak bank earnings this week, investors didn't expect much from Goldman Sachs (NYSE: GS ) by the time it reported Friday morning. The bank actually beat estimates, though analysts greatly reduced these estimates from levels of a week ago. Even after the sell off this week, the stock is struggling to gain traction with it trading down around $2.00 mid-day. Again, investors appear more concerned about momentum instead of the valuation proposition of the financial institution. Read the full update at Seeking Alpha.  Disclosure: No positions mentioned. Please review the disclaimer page for more details. 

Did Goldman Sachs Just Call The Top In SolarCity?

After warning investors back during mid-May to not fall for the hype on the soaring SolarCity ( SCTY ) , the stock spent the next five months in a downtrend. Only recently had the stock moved slightly higher than the warning level until Goldman Sachs ( GS ) issued an upgrade that caused the stock to soar over 11% at one point to a new all-time high at $67.14. SolarCity is a leader in the rooftop solar panel market and famously has Elon Musk as the Chairman of the Board. For those living under a rock, Elon is a revolutionary investor and inventor that is the CEO of both Tesla Motors ( TSLA ) and SpaceX . SolarCity offers solar power directly to consumers, businesses and government organizations for less than they spend on utility bills while taking care of the design and permitting process to get the panels installed. In addition, it handles all the monitoring and maintenance to ensure the rooftop solar panels continue to work properly. Read the full article at Seekin...

Top 10 Net Payout Yield Stocks For December

This article is a continuation of a monthly series highlighting the top net payout yield stocks that was started in June (see article ). The series highlights the best stocks for the upcoming month. Please review the original article for more information on the net payout yield concept. November Returns Below are two charts highlighting the monthly returns of the top 10 stocks from November (see original list here ). Due to limitations with YCharts, the chart was broken into the Top 5 and Next 5 lists. Read the full article at Seeking Alpha. Disclosure: Long AMP, COP, DTV, GS, KSS, MSI, NLY, WLP. Please review the disclaimer page for more details. 

Top 10 Net Payout Yield Stocks For November

This article is a continuation of a monthly series highlighting the top net payout yield stocks that was started in June (see article). The series highlights the best stocks for the upcoming month. Net Payout Yields Defined The net payout yield is the combination of the dividend yield and the net buyback yield added together to calculate the yield returned to shareholders. The net buyback yield adds stock repurchases and subtracts shares issued. The yield is calculated using the amount of buybacks over the last four quarters divided by the current market cap. Read the full article at Seeking Alpha. Disclosure: Long COP, DTV, GS, KSS, MSI, WLP. Please review the disclaimer page for more details. 

Investment Report - October 2012: Net Payout Yields

--> This model was up 2.1% in September versus a 2.4% gain for the benchmark S&P 500. The model slightly under performed the market in September, which can happen in solidly positive months. The model is now up over 20% for the year. Trades As mentioned in the last several monthly reports, one goal of this model is to slowly trim the amount of positions back closer to 20 after reaching 26 a few months back due to mergers and partial positions. The position count remained at 24 at month end, but a partial position in Vale S.A. (VALE) was increased in order to fill out the position. The Gap, Inc. (GPS) was sold, as the position became the largest one in the portfolio after an incredible gain by the stock. After a 100% gain for the year, the Net Payout Yields (NPY) declined to the point that Gap was no longer attractive for this model. Read our Seeking Alpha article for more details. With the cash from the Gap sell, Motorola Solutions (MSI) was purchased ...

Top 10 Net Payout Yield Stocks For October

This article is a continuation of a monthly series highlighting the top net payout yield stocks that was started in June (see article). The series highlights the best stocks for the upcoming month. Net Payout Yields Defined The net payout yield is the combination of the dividend yield and the net buyback yield added together to calculate the yield returned to shareholders. The net buyback yield adds stock repurchases and subtracts shares issued. The yield is calculated using the amount of buybacks over the last four quarters divided by the current market cap. Read the full article at Seeking Alpha. Disclosure: Long COP, GS, KSS, MSI, and WLP. Please review the disclaimer page for more details. 

Investment Report - August 2012: Net Payout Yields

This model was down 0.5% in July versus a 1.3% gain for the benchmark S&P 500. Oddly the model has fluctuated a lot in recent months with large cap stocks in the model moving up or down 10% on earnings reports. While typical of smaller companies this usually doesn’t happen in companies with market caps exceeding $10B. Trades As mentioned previously, one goal of this model is to slowly trim the amount of positions back closer to 20 after reaching 26   due to mergers and partial positions. Hence, the model sold the remaining holdings in Home Depot (HD) and added to existing small positions in Hartford Financial (HIG) and WellPoint (WLP). Home Depot was unloaded as the stock finished a long run from October last year where the stock went from just over $30 to the selling price over $51. This considerable gain pushed the Net Payout Yield (NPY) down as the company dropped buybacks. Not to mention that competitor Lowes (LOW) remains a Top 5 holding. The two purcha...

Top 10 Net Payout Yield Stocks For July

Not too surprisingly, the top net payout yield stocks from June (see article ) remained mostly intact as the month ended. Only Motorola Solutions, Inc. (MSI) was confirmed as a new addition to the list. Both Ameriprise Financial, Inc. (AMP) and Time Warner Inc. (TWX) tied for tenth on the July list with a 15.37% yield. So technically, no stock rolled off the list. The Covestor model typically holds over 20 stocks so neither stock would need to be sold, but anybody playing at home with ten stocks could just leave the model alone in order to avoid trading costs. Look to add Motorola Solutions to the model as one of those stocks lowers the yield via more stock gains or the reduction of a buyback. For those not familiar with net payout yields, it is the combination of the dividend yield and the net buyback yield. In essence, it is the percentage paid to investors. A typical fund focuses on dividends while some focus on buybacks, but recent history has shown that the stocks paying the l...

Investment Report - June 2012: Net Payout Yields

This model was down 7.7% in May versus a 6.3% loss for the benchmark S&P 500. In a rare occasion, the model underperformed the market by more than 100 basis points. While disappointing, this does happen sometimes. The benefit is that the stocks with large buybacks are able to purchase more shares at these cheaper prices. Trade Only one major position change was initiated in May with the addition of Ameriprise Financial (AMP) in two transactions. The company has a spectacular net payout yield exceeding 15% with the dividend portion at nearly 3%. The other major transaction was switching out of Phillips 66 (PSX) and back into a full position on ConocoPhillips (COP) after the spinoff back in April. After some research, ConocoPhillips provides the higher guaranteed yields while Phillips 66 remained uncommitted on buybacks. A half position in Home Depot (HD) was sold to reduce exposure to the home improvement sector since both Home Depot and Lowes (LOW) had become t...

Top 10 Net Payout Yield Stocks For June

After a big selloff, the advantages of Net Payout Yield stocks really comes into focus. These companies benefit from the strategic ability to repurchase shares and issue dividends. The market is currently enamored with dividend stocks, but those stocks don't exactly benefit investors when the stock drops. Investors are stuck with capital losses while collecting dividends, but the company can't do anything with the lower stock price to benefit shareholders. Companies that participate in large buybacks though have the ability to repurchase shares at much cheaper levels now. This benefit has largely been ignored by the markets over the years with the general sentiment that share repurchases aren't effective. The key though is that most investors don't focus on net share repurchases. Companies that greatly reduce the stock float provide more earnings for shareholders. Read the full article at Seeking Alpha. Disclosure: Long AMP, COP, DTV, GPS, GS, KSS, and TWX. Please...

Investment Report - May 2012: Net Payout Yields

This model gained a solid 0.8% in April versus a 0.7% loss for the benchmark S&P 500. The model remained strong all month even as the SP500 fluctuated all month. Trade No trades were made in the month of April as existing positions continued to work well with high yields. Top Performers Considering the market was slightly down and the model was only slightly up, not many positions had outside moves. The biggest gainers were Gap (GPS), Travelers (TRV) , and Chubb (CB). All three companies had very strong earnings partially helped out by the large buyback programs over the last year. Bottom Performers Just as with the top performers, not many stocks had outside negative moves in the month. The biggest losers were Conoco Phillips (COP), Goldman Sachs (GS) and Wellpoint (WLP) with all three companies losing more than 5%. Conoco Phillips had disappointing earnings that naturally pushed down the stock. The other two had surprisingly good earnings eve...

Investment Report - April 2012: Net Payout Yields

This model gained a solid 4.3% in March versus 3.1% for the benchmark S&P 500. The model remained strong all month even as the SP500 struggled toward the end of the month.   Trade March was a normal trading month for this model with only 1 trade initiated in order to reduce the cash balance. Time Warner (TWX) was bought as the stock flashed one of the highest Net Payout Yields in the over $10B market cap group with a huge buyback. The stock also maintains a strong 2.9% dividend providing for that investor class as well. For more details on why Time Warner was selected, please read this article . Top Performers The largest gains came from Lowes (LOW) , WellPoint (WLP) , Gap (GPS) , and Goldman Sachs (GS) along with several other stocks that had solid gains. Most of those stocks saw gains that exceeded 10%. Typical of a model that allows for trading signals based on an indicator such as the Net Payout Yield, a stock like Goldman Sachs was purchased ...

Investment Report - February 2012: Net Payout Yields

January was yet another solid month on an absolute basis, with a 3.9% gain for my Net Payout Yields portfolio, but on a relative basis the portfolio underperformed the benchmark S&P 500 that was up 4.4%. Though not unexpected as these large cap stocks will tend to slightly underperform on large up months. For the last 365 days the model continues to greatly outperform the market by outperforming during weak months. Dividend Risks As the market entered 2012, too much focus in the market was being placed on dividend yields with no concept of capital loss potential. As the dividend stocks rose into year end, this created the risk of capital losses in stocks yielding only 3-4%. Investors typically expect and want higher gains for a year. What happens when the stock drops for the year wiping out the benefit of the dividend? This highlights the benefits of a model that focuses not only on dividends but also stock buybacks. The typical stock owned in this model has 60-70% of its ...

Creative Uses Of Apple's Cash Hoard

As reported last week, Apple (AAPL) now has a cash hoard of over $97B while generating $17.5B in cash flow from operations in Q4 alone. Yes, that is correct. Apple has more cash than most countries have in GDP. Most investors want Apple to return the cash via a dividend or major stock buyback. Neither are that appealing to me as a typical investor buys Apple for growth. A 5% dividend yield could easily be swamped by a 10-20% loss in normal markets and maybe something bigger if the iPad5 was to disappoint. A stock buyback while seeming cheap with the stock trading at a roughly 10x forward PE, it doesn't provide a lot of value with the company trading at over 5x book value. Besides by the time it gets announced and implemented the stock might soar over $500. What I want from management is bold thinking similar to product concepts. Use that cash to provide an investment opportunity that most investors don't have access too in these markets. Use that cash to fund deals in highly ...

How Net Payout Yields Predicted Financial Stocks' Earning Results

Going into this earnings release, investors appeared a lot more bullish on Capital One Financial (COF) than Goldman Sachs (GS). Capital One's stock was trading at 6 month highs and Goldman was near the lows. All the media could focus on was how bad the investment banking and brokerage business was for Goldman Sachs. Management, though, was telling a different story to anybody paying attention. All year Goldman Sachs has been busy buying back stock while Captial One was focused on repaying debt, either signaling that the stock wasn't that cheap or maybe the future wasn't that bright. In our Net Payout Yields Model, these signals were used to switch out of Capital One at the end of December and into Goldman Sachs at the beginning of January. Contrary to the typical opinion in the market about stock buybacks, large caps with strong earnings profiles tend to benefit from buybacks. The media tends to focus on the failures such as Netflix (NFLX) while the winners go unnoticed...

Wild Times at MF Global Holdings

Today Moody's downgraded MF Global (MF) to Baa3 putting them on the verge of junk status. Then, MF announced that it has upped the Q3 earnings report to tomorrow morning instead of Thursday. This all comes after last week MF had to increase capital after the Financial Industry Regulatory Authority (FINRA) raised concern about exposure to European sovereign debt. All of this new has led the stock to a hit a fresh 52 week low of $3.48 today. All the way down from a 52 week high of $9.28 back in January. Considering financial like Goldman Sachs (GS) and Morgan Stanley (MS) have had huge bounces recently, it should be concerning to any investor that Wall Street knows something. Is this extreme fear warranted? Is $6.4B of exposure to Italy, Spain, Belgium, Portugal, and Ireland with a weighted maturity of October 2012 worthy of a drop from $7.5 at the start of August? Heck, Citigroup (C) stock is already above levels from mid-August with sights on the pre market collapse levels....

TARP Bailout to Only Cost $25B

And that assumes the cost won't continue to drop. The Trouble Asset Relief Program (TARP) continues to be scorned by most people costing many backers their political positions, but ironically it has turned into one of the most successful government programs ever. Ok, its very possible that the politicians lost their jobs due to the numerous other packages enacted after TARP that weren't nearly as successful. Anybody hear of any benefits from the stimulus package? Today the Congressional Budget Office (CBO) estimated that the $700B TARP program would only end up costing taxpayers $25B an absurdly low number considering the consternation when it was enacted. Back then lots of focus was on the $700B being a taxpayer cost instead of an investment in the financial system that was about to collapse. In fact, it would've been a lot more successful if the focus hadn't strayed to the weak companies like General Motors (GM) and AIG. Somebody explain to me how GM is back publ...

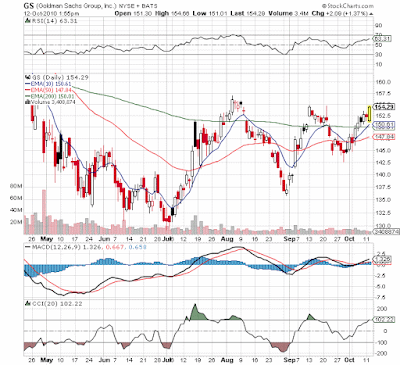
Goldman Sachs Triple Top Breakout?

Image
Very interesting to see the stock of Goldman Sachs (GS) appear headed to a triple top breakout when just about every analyst has downgraded its earnings potential due to reduced trading profits and market activity. Not to mention that the stock is ramping prior to earnings just a week away on the 19th. Also, note the higher lows in the chart pattern suggesting further strength in the stock. The lower moving averages are about to cross the 200ema which is another very bullish sign. Though my portfolios have no position in GS, the stock is a leading indication of financials and the market in general. Right now the stock says the market is headed higher. Our favorites in this general area remain MF Global (MF) and International Assets (IAAC) both of which have been breaking out lately as well.