Posts

Showing posts with the label HIG

IB Net Payout Yields Model

Hartford Doesn't Need A Buyout

Hartford is too cheap to accept a buyout with a limited premium. The consistent earnings profile and huge capital return plan position shareholders for solid returns going forward. The recommendation remains to own Hartford based on value. With an intra-day spike to near $51 on high volumes, The Hartford (NYSE: HIG ) is under accumulation based on rumors of a buyout offer. Back when Chubb Corporation (NYSE: CB ) accepted a buyout offer, Hartford was listed as a prime buyout target in the P&C space so this shouldn't be a big surprise. Read the full article on Seeking Alpha. Disclosure: Long HIG. Please read the disclaimer page for more details. 
Top 10 Net Payout Yields For August 2015

The top ten net payout yields outperformed the market in July due to several stocks with monthly gains in excess of 9%. The top ten net payout yield stocks average yields of 14.7% to start August. Motorola Solutions continues to hold the highest yield now at 25.7%. This article is a continuation of a monthly series highlighting the top net payout yield (NYSE: NPY ) stocks that was started back in June 2012 (see article ) and explained in August 2012 (see article ). The series highlights the best stocks for the upcoming month utilized in part to make investment decisions for the Covestor model that has beaten the S&P 500 for four consecutive years. Please review the original articles for more information on the NPY concept. Read the full article at Seeking Alpha. Disclosure: Long GM, HIG, MSI, NLY, NOC, NTAP, TRV, VIAB. Please review the disclaimer page for more details. 

Top 10 Net Payout Yield Stocks For July 2015

The top ten net payout yields underperformed the market in June due to several stocks with larger losses than the S&P 500 index. The top ten net payout yield stocks average yields of 14.0% to start July. Motorola Solutions continues to hold the highest yield now at 27.0%. This article is a continuation of a monthly series highlighting the top net payout yield (NYSE: NPY ) stocks that was started back in June 2012 (see article ) and explained in August 2012 (see article ). The series highlights the best stocks for the upcoming month utilized in part to make investment decisions for the Covestor model that has beaten the S&P 500 for four consecutive years. Please review the original articles for more information on the NPY concept. Read the full article on Seeking Alpha. Disclosure: Long HIG, MSI, NLY, NOC, NTAP, TRV, VIAB. Please review the disclaimer page for more details. 

Top 10 Net Payout Yield Stocks For May 2015

The top ten net payout yields underperformed the market in April due to a couple of weak individual stocks. The top ten net payout yield stocks averaged yields of 13.6% to start May. Motorola Solutions continues to hold the highest yield now at 25.8%. This article is a continuation of a monthly series highlighting the top net payout yield (NYSE: NPY ) stocks that was started back in June 2012 (see article ) and explained in August 2012 (see article ). The series highlights the best stocks for the upcoming month utilized in part to make investment decisions for the Covestor model that has beaten the S&P 500 for four consecutive years. Please review the original articles for more information on the NPY concept. Read the full article on Seeking Alpha. Disclosure: Long HIG, MSI, NLY, NOC, NTAP, TRV, VIAB.

Top 10 Net Payout Yield Stocks For April 2015

The top ten net payout yield stocks underperformed the market in March due to a couple of weak individual stocks. The top ten net payout yield stocks averaged yields of 13.3% to start April. Motorola Solutions continues to hold the highest yield now at 18.7%. This article is a continuation of a monthly series highlighting the top net payout yield (NYSE: NPY ) stocks that was started back in June 2012 (see article ) and explained in August 2012 (see article ). The series highlights the best stocks for the upcoming month utilized in part to make investment decisions for the Covestor model that has beaten the S&P 500 for four consecutive years. Please review the original articles for more information on the NPY concept. Read the full article on Seeking Alpha. Disclosure: Long HIG, IBM, MSI, NLY, NTAP, TRV, VIAB. Please review the disclaimer page for more details. 

Hartford: High Yields To Own

Summary The Hartford reported Q4 earnings that beat analyst estimates, yet the market was unimpressed with the 2015 growth forecast. The insurance company has a large stock buyback program that is increasing value considering the stock trades at or below book value. Investors shouldn't attempt to over analyze the stock and instead use the high yields to guide the way.          As with any large insurance company approaching $19 billion in annual revenue, lots of analysis can go into the quarterly earnings of The Hartford (NYSE: HIG ) . The company offers property and casualty insurance for both commercial and personal lines along with group benefits and investments via mutual funds. Read the full article at Seeking Alpha.  Disclosure: Long HIG. Please review the disclaimer page for more details.   

Berkowitz Remains Bullish On Sears Holdings

Very interesting interview with Bruce Berkowitz on CNBC today. Bruce is the famous founder and manager of Fairholme Capital Management. The interview is mostly regarding the bets on Fannie Mae and Freddie Mac preferreds, but he does confirm that the Sears Holdings (SHLD) investment thesis remains intact. He still sees a 10x increase in the value of Sears to match the value of the real estate holdings. He makes some compelling statements regarding investing in Fannie and Freddie. Maybe we need to check those out considering some our investments match his. Instead of American Int'l Group (AIG) , we chose to invest in Hartford Financial (HIG) and Lincoln Financial (LNC) to obtain exposure to insurers trading under book value. After all, investing in stocks trading below the long-term value is a core position of Stone Fox Capital. Disclosure: Long HIG, LNC, and SHLD. Please review the disclaimer page for more details. 

Buy the Financials Still Trading Below Book Value - Part 1

Even after substantial gains this year, a whole slew of financial stocks still trade below book value. As written about back in January, a good portion of the insurance stocks traded close to half of book value. While the fears from the financial crisis have mostly dissipated, the stocks continue to meander below book value even with strong earnings profiles. Investors continue to fear that either the balance sheet isn more » Disclosure: Long HIG and LNC. Please review the disclaimer page for more details. 

Investment Report: Net Payout Yields Model - May 2013

This model was up 3.4% in April versus a 1.8% gain for the benchmark S&P 500. The model out performed the market in April to build onto a solid start from the first quarter of 2013. As of the end of April, the model was up nearly 15.1% for the year compared to 12.0% for the S&P 500.   In general, the model remains very uneventful with only one trade for the month. Bottom Performers Since the model had a strong month, only a couple of stocks had a negative return for April. The weakest stock was Motorola Solutions (MSI) with a loss of over 10%. Only a few other stocks even posted a loss and none of those are worth mentioning. Motorola Solutions reported a weak quarterly report that sent the stock down significantly. The theory of the model doesn’t care about the fundamentals of the company so the key will be whether the management team continues to buyback stock and pay dividends. With a dividend yield of only 1.8%, the key with this stock will...

Buy the Financials Trading Below Book Value

After the financial crisis, numerous financial-related stocks traded at prices below book values due to the fears in the accuracy of the reported balance sheets. In the years since the crisis, most of those fears have disappeared, yet many financial stocks haven’t regained the valuations suggested by the improving asset bases. A prime example exists in the insurance and retirement services sector where both Hartford Financial Services Group (NYSE: HIG   more » ) Disclosure: Long HIG and LNC. Please review the disclaimer page for more details. 

Investment Report - October 2012: Net Payout Yields

--> This model was up 2.1% in September versus a 2.4% gain for the benchmark S&P 500. The model slightly under performed the market in September, which can happen in solidly positive months. The model is now up over 20% for the year. Trades As mentioned in the last several monthly reports, one goal of this model is to slowly trim the amount of positions back closer to 20 after reaching 26 a few months back due to mergers and partial positions. The position count remained at 24 at month end, but a partial position in Vale S.A. (VALE) was increased in order to fill out the position. The Gap, Inc. (GPS) was sold, as the position became the largest one in the portfolio after an incredible gain by the stock. After a 100% gain for the year, the Net Payout Yields (NPY) declined to the point that Gap was no longer attractive for this model. Read our Seeking Alpha article for more details. With the cash from the Gap sell, Motorola Solutions (MSI) was purchased ...

Investment Report - August 2012: Opportunistic Levered

This model lost a disappointing 6.6% in July versus a 1.3% gain for the benchmark S&P 500. This model typical outpaces the major indices by a large margin in up periods so the last month was a major exception. Since the end of 2011, this model has been running on the theme that the majority of stocks would retrace the losses experienced since the July 2011 levels. In essence, our theory all along has been any losses since that time period were from irrational fear of a second financial collapse that the Europeans were unlikely to allow. Naturally this fluctuates on a case by case basis where any individual stock could move a lot higher or lower depending on circumstances since then. Unfortunately this theory took a major hit as investors piled into dividend paying stocks sending most major indices back close to 2012 highs while at the same time selling the higher risk, global growth stocks. In some cases, stocks actually hit new 52 week lows recently. T...

Investment Report - August 2012: Net Payout Yields

This model was down 0.5% in July versus a 1.3% gain for the benchmark S&P 500. Oddly the model has fluctuated a lot in recent months with large cap stocks in the model moving up or down 10% on earnings reports. While typical of smaller companies this usually doesn’t happen in companies with market caps exceeding $10B. Trades As mentioned previously, one goal of this model is to slowly trim the amount of positions back closer to 20 after reaching 26   due to mergers and partial positions. Hence, the model sold the remaining holdings in Home Depot (HD) and added to existing small positions in Hartford Financial (HIG) and WellPoint (WLP). Home Depot was unloaded as the stock finished a long run from October last year where the stock went from just over $30 to the selling price over $51. This considerable gain pushed the Net Payout Yield (NPY) down as the company dropped buybacks. Not to mention that competitor Lowes (LOW) remains a Top 5 holding. The two purcha...

Attractive Financials Trading Below Book Value

Most financial stocks haven't recovered from the financial crisis even though the business has returned to solid profits. The growth doesn't exist like it did prior to the crisis but income shouldn't be ignored. The insurance sector remains one of the most undervalued sectors in the market. Stocks like Hartford Financial (HIG), Lincoln National (LNC), MetLife (MET) , and Prudential Financial (PRU) trade significantly below book value. The group consistently traded at over 1.5x book value prior to the crisis. Though all of these companies have variant business lines, the stocks have traded in an incredibly consistent pattern. Some such as Prudential have already significantly exceeded the book value per share from before the crisis yet the stock trades at a paltry 0.59 of book value. Read the full article at Seeking Alpha. Disclosure: Long HIG and LNC. Please review the disclaimer page for more details. 

Paulson Does Some Agitating At Hartford Financial

After the close last night, Paulson & Co filed a 13D disclosing a presentation to the BOD and a letter sent to the CEO. The goal being for Hartford Financial (HIG) to begin the process of a spin-off of it's Property & Casualty business. Simply Paulson believes that Hartford has an industry low valuation due to the combination of both the P&C and Life business lines that competitors all spun-off long ago. He makes a compelling pitch that the ultra low valuation for the company is based on the thesis that analysts just don't follow or understand it due to the combined business lines. A Travelers (TRV) that focuses on P&C or a Lincoln Financial (LNC) that focuses on Life have higher multiples since the analysts follow either business line, but not both. Without doing all that research I could've told them that Hartford was incredibly cheap trading at close to 40% of book value. Paulson though has an army of analysts that did some incredible research. Ho...

Hartford Financial Reports 17% Increase in Book Value

Image
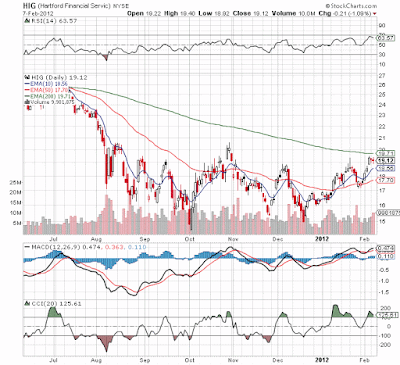
Following on the report from Lincoln Financial (LNC) , Hartford Financial (HIG) reported solid earnings of $.69 that beat estimates by $.07. More importantly though Hartford reported the book value jumped to $47.25, up 17% on the year. Per Briefing.com : 4:18PM Hartford Financial beats by $0.07 ( HIG ) 19.12 -0.21 : Reports Q4 (Dec) earnings of $0.69 per share, $0.07 better than the Capital IQ Consensus Estimate of $0.62. 2011 was a difficult year for Hartford with record cat weather related losses. Yet the company still reported earnings of $1.94 for the year. More importantly the company was able to repurchase 3.2 million shares at $15.93 per share in Q4'11. It has already bought another 2.6 million shares in Q1'12 at $16.58 per share. Not only were these purchases at roughly 35% of book value, but so far they were done at prices lower than the current market price of $19. With a $400M authorization left, management should've bought all they could in Q4. Per...

Revisiting Stocks That Could Recalim July Highs

Back in October I wrote an article about how stocks could reclaim highs from July. At the time, numerous stocks were down 50-60% from those July highs after the dramatic summer sell-off that didn't appear to be justified. Since that article, numerous stocks such as Toll Brothers (TOL) and F5 Networks (FFIV) have already recaptured the July highs and more. Much to my surprise, homebuilders lead the market higher. Not to mention the Nasdaq composite has soared to 11 year highs. Clearly the theory has worked in some situations, such as the above growth stocks and particularly with most dividend-paying stocks. Numerous stocks still trade considerably below those July highs, providing opportunities for investors. The original report focused on Riverbed Tech (RVBD), Terex (TEX), Hartford Financial (HIG), and Weatherford International (WFT) . None of these stocks has recaptured those July highs providing plenty of opportunity for investors to still get in on these stocks. Read ...

Investment Report - Opportunistic Levered: January 2012

After a strong 2009 and 2010, 2011 was a year to forget for this portfolio. The market hit highs around the end of April and this model was soaring to new heights at the time. Many of the holdings had valuations nowhere near the 2007/08 peaks or even close to what would normally be considered rich. Regardless, leverage was reduced since some gains were significant. Then, unfortunately most of the stocks collapsed and even in a few cases approached 2009 lows. With too much leverage left, the model was hit very hard. The good news is that valuations started the year as attractive as during the financial collapse of 2009. 2012 Outlook Portfolio Construction The portfolio remains overweight on the global growth theme. Most of the stocks in this sector trade as if emerging markets are headed towards a recession instead of continued growth. The biggest challenge to our investment strategy in 2011 was the major inflation fears in emerging markets like China, India, and Brazil. As 201...

Investment Report - January 2012: Net Payout Yields

December was yet another solid month on a absolute basis, with a 0.53% gain for this portfolio, but on a relative basis the portfolio underperformed the benchmark S&P 500 that was up 0.85%. For 2011, the portfolio was up 6.82% versus 0.0% for the benchmark. Despite all the volatility in the markets, the Net Payout Yields Model had a good absolute and relative performance for the year. 2012 Outlook  Since this portfolio is not dependent on fundamental analysis or economic forecasts, it isn't always prudent to focus on the prognosis for the stock market and economy. The whole goal is to find high net payout yielding stocks and then harvest the benefits of huge dividends and stock buybacks. In a way, let the management teams earn their money while investors enjoy the spoils. Naturally as an investment advisor with other active portfolios, I definitely have opinions on the market and economy but it just doesn't seem prudent to focus on them here. Anybody interested can vi...

Investment Report - December 2011: Net Payout Yields

This report is very behind schedule this month, but I thought it was worth writing anyway. This model continues to work well and the word needs to get out more about the advantage of net payout yields over just focusing on dividends. November was yet another solid month, with a 0.05% gain for this portfolio, on both a relative and absolute basis, as the benchmark S&P 500 lost 0.51%. When the market has down months this model continues to shine and overtime the results become much more evident. For the last 12 months, the portfolio was up 12.72% versus the 5.63% for the benchmark. Despite all the volatility in the markets, the Net Payout Yields Model has had a great absolute and relative performance. Trades The model had only one trade in November. Lowes (LOW) was purchased on November 1st as the net payout yield (NPY) surpassed 16% at the end of October. While LOW only paid a dividend of 2.6% at the time, 2.3% now, the company bought back a significant amount of stock in the f...