Posts

Showing posts with the label Russell 2000

IB Net Payout Yields Model

Russell 2000 Closes Above 1,000 For First Time

Image
Even though a lot of the small cap growth stocks still struggled, the Russell 2000 Small Cap Index closed above 1,000 for the first time. The index has surged after trading below 750 last summer. As the below chart shows, the index appears headed even higher as a breaks out of the recent range. Disclosure: No positions mentioned. Please review the disclaimer page for more details. 

S&P 500 Approaches Recovery Highs

Image
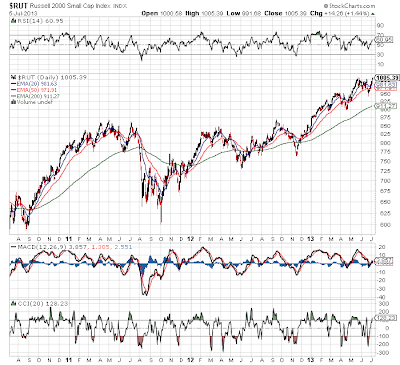
Not many people probably realize this, but the S&P 500 is approaching the yearly highs and the post recovery highs. Back at the end of April the market peaked out around 1,420 and sold off down to 1,270. Amazingly though considering the turmoil still going on in Europe and the weakness in China, the market rallied to 1,386 on Friday. Placing it just a small rally away from those highs. See the chart below: Chart - S&P 500 Note the higher highs and lower lows over the last two months very much indicating a breakout. The small cap Russell 2000 has not had the same outcome. While not too far behind the large caps, the smaller cap index still remains below the July peak at 820 and further behind the end of March top around 850. Chart - Russell 2000  The main reason for the outperformance of the S&P 500 remains the popularity of dividend paying stocks that are more common in that index. As investors become more comfortable with the stock market and its ab...

SP 400 Mid Cap Index Hits New Highs

Image
Today the SP 400 Mid Cap Index closed at new highs for this rally signaling that a breakout in the overall market is likely at hand. This index holds the market changing stocks of the US economy and any move higher is a likely indication of what the SP500 and DOW will do in the weeks and months to come. The Russell 2000 is making a move towards its highs as well closing at 618 within range of its highs just 1% higher around 625. The risk trade is apparently back on after being off for the last 2 months. SP 400 Mid Cap Index Russell 2000 Index

Russell 2000 Weakness

Image
Since late September, the Russell 2000 has been particularly weak. The index of small cap stocks made a slightly higher high in mid October, but hasn't come close to the 625 high in November while the S&P500 continues to trade above the Sept/Oct levels. Part of the reason could be that a lot of the smaller cap stocks are more domestic plays and the more international exposure you have the better. Its also been the case that financial stocks such as regional banks have been weak during that period. Regardless its led our Growth Portfolio to underperform the last month after a huge outperformance this year - up nearly 70%. A lot of the smaller investments such as Liz Claiborne (LIZ) have been hit hard after surging. LIZ is down from a high around $7.5 all the way to $4.5. Many other examples exist as well. Hard to explain why the smaller stocks have been so weak with the world economy showing signs of growth. They should do better in a recovering economy. Maybe people were just ...