Posts

Showing posts with the label Yield Curve

IB Net Payout Yields Model

No Double Dip According to Treasury Spread

Mark Perry's Carpe Diem blog had a great little post on the recession predictive ability of the Treasury Spread. The New York Fed has a great chart that I've used in the past that predicts the possibility of a recession over the next year based on the treasury spread between the 10 year bond rate and the 3 month bill rate. As the chart shows, the possibility of a recession is below 1%. It just doesn't seem to happen when the treasury spread is this large. The market is increasing worried about a recession even though it just isn't likely under the current monetary circumstances. Clearly when an economy hits a soft patch as it did during April and May, the slant of the yield curve is hugely important in determining the next move whether up or down. With such a positive curve at over 3%, corporations and investors are encouraged to take on risks and in essence buy the dips. While a negative sloping yield curve causes the reduction in borrowing and business expansion...

Chances of a Double Dip?

Anybody following the markets know that everybody thinks the chances of a double dip recession has increased dramatically of late. Incredible considering double dips have only happened 3 times in the last 100 some years. Notable doom and gloom expert Roubini upped his estimate to 40% via a tweet yesterday. Why is there so much gloom considering the best indicator of all time signals that odds are nearly 0%? The Yield Curve has always been the best indicator of booms and busts yet they seem to get ignored all the time. During a boom, negative yield curves get brushed aside. During rough patches, they are assumed not useful this time based on the particular crisis of the time. The New York Fed produced these charts showing the predictive ability of the spread between the 10 year Treasury bond and the 3 month T-bill. The very positive yield curve predicts a virtually impossible chance of a double dip this time around. Notice how the chances of a double dip in the early '80s was n...

Rising Interest Rates Aren't Always Negative for Stocks

Image
It seems intuitive and the markets always seem to react as if rising rates are negative for equities and declining rates are positive for equities. As usual with the stock market, simple thinking can burn you very fast. The market is much more complex then just "Don't Fight the Fed". Go back to 2008 and question that thesis. Rates were declining and stocks were getting crushed. Why? Well its because even though the interest rate direction has an impact on the economy it takes a long time of up to 12 months for the impact to be felt. When the Fed is lowering rates from an already low level it signals distress which leads to panic in the markets. Did the Fed lower the fed funds rate from 2% to 1% because it wanted to juice the recovery or because they feared the Great Depression II? The announcement by the Fed last Thursday night after markets closed that they were raising the discount rate to 0.75% from 0.50% nearly sent panic around the world. That is until the US market...

Yield Curve, Yield Curve, Yield Curve

As we've touched on several times in the past, the Yield Curve or the difference between the 10 Yr Treasury and the 90 Day is very predictive of future economic growth. A wide difference in yields of 2% of more is usually very conducive to growth while a flat to negative yield curve signals tough times ahead - credit is restricted at those levels. Bloomberg had an article today about the Yield Curve being the highest since 1992. Now they use the difference between the 30 Yr and the 2 Yr securities, but it's still the same philosophy with different versions of long term versus short term yields. No matter which version you use, when the Yield Curve is 368 basis points banks are literally printing money by borrowing it for next to nothing and lending it at much higher rates. Just think how your savings account pays next to nothing, but a 30 year mortgage is around 5%. One major problem though is that banks are having a hard time finding qualified borrowers of that cheap cash. A...

The Ultimate Leading Indicator: Yield Curve

Image
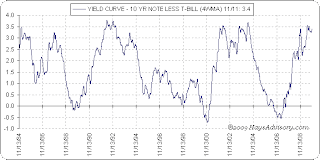
As we've been fond of pointing out this year, the leading indicators tell us where the market is going. A lot of investors have fought the trend by concentrating on lagging jobs reports or focusing on future write downs at banks. Those are all concerns, but the leading indicators have told us for months that the future is bright. One of the best leading indicators around is the Yield Curve. Unlike most indicators whether leading or lagging this one can be followed on a daily basis and doesn't rely on random sampling or questionable government reports. The old addage of don't fight the fed is alive and well. As the chart below shows, when the Yield Curve is above 3% or the difference between the 10 yr and 90 day Treasury bills yields that is the time to buy stocks. Conversely, when the yield flattens out and becomes flat is the time to sell stocks. The negative yields in both 2000 and 2007 were huge warning signs of impending problems. One interesting note going back to the...

Stat of the Day: Off the Charts Yield Curve

Image
Another indication of the whackiness in this market. The yield curve is now off the charts bullish. This usually has a very positive impact on future bank earnings, but in a market where lending is limited its difficult to determine if the impact will be like normal cycles. Typically banks are encouraged to lend like crazy because the spread is so positive for them, but that isn't happening this time because of the financial crisis. You can bet though at some point in the future, this yield curve will help return the market to growth and inflation. In fact, its likely to cause irrational investments as it always does at the peaks and troughs. This number is off the charts because of the huge compression in the rates of the T-bill. Its unlike anything the market as seen even in the last 25 years. Anytime this ratio gets above 2 it becomes very bullish for the future economy. The markets tend to forget that in periods of extreme bullishness or negativity that such monetary realities ...