Posts

Showing posts with the label Market Ramblings

IB Net Payout Yields Model

Market Approaching 4 Years Highs

Image
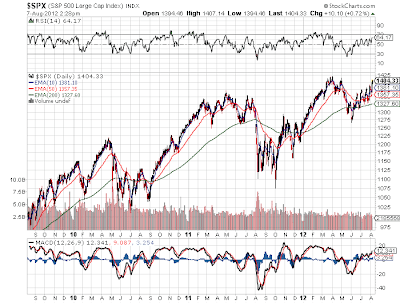
Quick, how many people expected the stock market to surge towards multi year highs at the start of August? The very time period where the market nearly fell off the cliff last summer. Even as the European issues continue to mount, it finally appears that the market has gotten past the never ending financial crisis. Not to mention that earnings report after earnings report provided solid numbers. Is the market finally able to focus on company specific events or will it be right back to the nuances in Europe as the Olympics end? In fact, maybe the Olympics have only hidden the issues as the world focuses on sporting events instead of financial issues. Don't be surprised to see next week bring out some fear mongering stories. For now, if your in the stock market just sit back and enjoy the gains while the average person is sitting on the sidelines watching stocks soar. 3 Year Chart - S&P 500 Disclsoure: No positions mentioned. Please review the d...

S&P 500 Approaches Recovery Highs

Image
Not many people probably realize this, but the S&P 500 is approaching the yearly highs and the post recovery highs. Back at the end of April the market peaked out around 1,420 and sold off down to 1,270. Amazingly though considering the turmoil still going on in Europe and the weakness in China, the market rallied to 1,386 on Friday. Placing it just a small rally away from those highs. See the chart below: Chart - S&P 500 Note the higher highs and lower lows over the last two months very much indicating a breakout. The small cap Russell 2000 has not had the same outcome. While not too far behind the large caps, the smaller cap index still remains below the July peak at 820 and further behind the end of March top around 850. Chart - Russell 2000  The main reason for the outperformance of the S&P 500 remains the popularity of dividend paying stocks that are more common in that index. As investors become more comfortable with the stock market and its ab...

Could the S&P 500 Hit 1,700 This Year?

Image
Of course not. Why would the market ever breakout to new highs? Aren't the financial markets headed for collapse? According to Laszlo Birinyi, president of Birinyi Associates, in this CNBC report the possibility really exists for a further 24% increase this year to 1,700. The good news is that just about every market pundit has blown off this view that the possibility increases. A 35% gain in the markets is far from unprecedented especially when the year began with sub par valuations. According to Birinyi, this is just a continuation of the bull market began back in 2009. According to him, this run looks similar to the 1982 and 1990 runs. Neither is likely to be repeated, but for any investor to dismiss the possibility would probably be reckless. Especially considering any break of current levels ushers in a return to old highs in the 1,500s. A further break of that would likely lead to nice gains beyond the old high leaving 1,700 as a likely stop. Laszlo has been bul...

Why This Isn't 2008 FCX Style

Most people either love or hate Jim Cramer, but they're making a mistake to just ignore his research. Last night Cramer had a great example of why 2011 will not be a repeat of 2008. Corporate balance sheets are much stronger now. For the most part, companies have shored up their balance sheets with the massive profits in 2010 and so far in 2011. Freeport McMoRan (FCX) is no exception to that common thought process. In the video below, he highlights the massive shift from a large net debt position in 2008 to a positive cash position now. So while FCX was forced to cut the dividend in the midst of the 2008 market crash now it might just increase the payout as it keeps earning loads of cash. Naturally this is just one focus point in a market with thousands of data points, but the vast majority of companies are in the same position. Record profits combined with tepid spending and hiring leaves companies in positions where they don't have to cut back spending, fire employees, or...

5 Stages of Grief for Optimistic Dyslexics

Laszlo Birinyi remains one of our favorite market prognosticators with his willingness to literally stick his neck on the line with very bullish calls that the market will at least exceed 2,000 in the next 13 months. In other stories, he has even predicted the eventual bull market could top out around double the current level. Considering the typical analysts will hardly predict 1,450 on the market much less 1,500 his prediction really sticks out. Most analysts still debate whether the market will avoid another recession and anybody predicting doom and gloom obtains more press coverage. Below are some details and a clip from his interview on Breakout.  My only concern is that uber-bear and host Jeff Macke sure appears to be turning bullish. Or at least he doesn't push back on Laszlo that much allowing his bullish case to remain unscathed. Birinyi puts the market into context via a model which categorizes a bull move into a template of four phases. Think of it as the 5-stage...

No Double Dip According to Treasury Spread

Mark Perry's Carpe Diem blog had a great little post on the recession predictive ability of the Treasury Spread. The New York Fed has a great chart that I've used in the past that predicts the possibility of a recession over the next year based on the treasury spread between the 10 year bond rate and the 3 month bill rate. As the chart shows, the possibility of a recession is below 1%. It just doesn't seem to happen when the treasury spread is this large. The market is increasing worried about a recession even though it just isn't likely under the current monetary circumstances. Clearly when an economy hits a soft patch as it did during April and May, the slant of the yield curve is hugely important in determining the next move whether up or down. With such a positive curve at over 3%, corporations and investors are encouraged to take on risks and in essence buy the dips. While a negative sloping yield curve causes the reduction in borrowing and business expansion...

Toyota Returning to 90 Percent Production Levels

Image
In a sign that the global economy will return to normal production levels in June, Toyota now expects to hit production levels approaching 90 percent. Considering Toyota is the largest producer in Japan, this return to normalcy should shift the global auto market back into balance. Competitors could likely make up any difference at those levels. After weak May manufacturing numbers spoked the market, the June numbers should be predictably better. The market doesn't act like the facts matter, but the data should naturally improve considering the major impact to both jobs and the growth numbers have been the auto sector. The industry will undoubtedly see higher numbers possibly approaching February numbers prior to the quake. Outside autos, no evidence exists that a significant slowdown is under way around the world. Heck, even Dr. Copper has lurched back to $4.13/lb signaling strong demand. Copper bottomed out in mid May most likely when global production especially in Japan saw...

Japan Industrial Production to Roar Back

Image
As world economies limp through weak data over the last two months, the market needs to look no further then Japan. After the March 11th earthquake and tsunami, industrial production plunged 15.5%. In April, it only bounced back 1%. While better then a decline, it was still a anemic rebound considering the huge plunge. Clearly signals of the short term impact to the global economy. The good news though is that companies in Japan expect a major recovery in May and June. The May industrial production number is expected to soar by 8% and June up over 7.7%. Nearly back to the pre quake levels at that point. Output rose 1.0 percent last month, below analysts' median 2.8 percent forecast, but manufacturers sharply increased their forecast for May, predicting output would rise 8.0 percent compared with the previous 2.7 percent forecast, data from the Ministry of Economy, Trade and Industry showed on Tuesday. Companies expect the recovery to continue in June with production seen ris...

Hays Advisory's Bullish Codes

Great video from Don Hayes of Hays Advisory. Don and his team does one of the best jobs of translating market data into actionable information. Whats important about his information is that it shows the real picture of whether the market is too bullish or bearish. Whether valuations are attractive. Or whether the Fed is a headwind or tailwind to the economy. According to his latest readings, the market is in a very attractive position for stocks as valuations remain extremely attractive and the monetary conditions are very positive. His only concern is psychology was too bullish leaving April, but that now appears cleared up with the drop in May. Check out the video below:

Don't Expect a Market Correction Anytime This Year or Next

As the two year anniversary of this bull market that started in March 2009 has come and gone, it's time to actually review some of the facts surrounding typical bull markets. From listening to numerous media reports yesterday, its common place for analysts and hosts to spew out information without researching the past. From this Bloomberg article , numerous real facts about the market were revealed. It's also revealing that alot of the players that called the bottom remain bullish and alot of the cronies that called for a further correction are still bearish. Sometimes it makes you wonder if any of the so called bears had any real insight other then a broken clock is correct twice a day. It also makes me wonder if we'll say the same about the bulls down the road. Clearly a two year rally without a 20% correction seems impressive and sounds like a very long time. At least thats what you get from the typical media. But is it really all that impressive? According to resear...

Sinking Importance of the PE Ratio or so They Say

Interesting article from the Wall Street Journal that summarizes our frustration with the current market. Rather though being the death of the Price to Earnings Ratio (or PE) the markets will likely look back in 5 to 10 years and wish they'd paid attention. Corporate profits are at record levels and companies with low PEs are likely to outperform in the next decade. Especially when considering the PEG ratio or the growth component of the earnings. Companies with growth rates higher then the PE will undoubtedly outperform. In the markets eyes though, the question remains on how to determine which companies will outperform. Some of the winners like Salesforce.com (CRM) have already soared to outlandish PEs because market has deemed their growth as transformational. The market thinks CRM will grow rapidly even in a weak economy so they've priced in the growth. Other stocks are marred with low PEs and reasonable growth estimates that have a low risk of not exceeding a 6-8 PE. ...

Doug Kass Calls a Bottom Again

So far he has been 2 for 2. Kass called the 'generational' bottom back in March 2009 and again called a bottom at the end of June leading to the large rally in July. He isn't overly bullish but he doesn't see the market going much lower with SP500 earnings of $90 next year. Stone Fox is much more bullish then Kass, but we do agree with his reasoning that the tax and regulation issues holding this market back will likely start to loosen up. The Democrats have a multitude of reasons to become more market friendly as their policies of the last couple of years have done nothing for job creation and the economy. Some bullish moves should help the market going into the November election. Kass has been the best caller of bottoms over the last couple of years so we'll stick with his predictions until he is proven wrong. Not to mention that the SP500 has a ton of support over the next 15-20 points lower so its not rewarding to go short at these levels. Clip from Fast M...

Downtrend Broken (For Now)

Image
It appears that the downtrend started on April 26th has finally been broken. Our at least for the moment because lately the market could just as easily whipsaw back down this afternoon. Bullish earnings reports from CAT, T, UPS, and others helped pushed the focus back to earnings and away from the rehashed story that Bernanke told yesterday. The key that most people seem to be missing is that corporate profits are based on what's going on in China, Southeast Asia, and South America as much as the US. So the economy can remain weak, but that doesn't mean that profits will follow the US. Stocks remain extremely undervalued because of the focus on valuing the market based on US weakness. As of 12:20cst, the market has actually broken above the 200ema which would be extremely bullish. Lately though it hasn't been able to hold these bullish levels so we'll need a good close and a positive follow through. Looking at the chart a close above 1088 breaks the downtrend and of cou...

So Much for Clarity!

Yesterday the market got most of the negatives holding it back solved.... Goldman Sachs, BP, and FinReg. Heck, even Apple resolved the issue with the iPhone4 today. So what happened other then a 200 point jump in the Dow? Oh wait, the market didn't even jump at all and had a nearly 3% drop. Huh? Were the earnings of Bank of America (BAC) and General Electric (GE) that horrible? Oh wait, they actually beat earnings and the news about the FinReg costs to BAC shouldn't have been that shocking. Consumer Confidence had a huge drop, but who was shocked by that? The markets saw a huge drop over the May/June peirod. What consumer could be confident? Maybe today's huge drop was just a headfake from an overbought position. The news going forward will be bullish for a market run. Nothing to hold us back now and a lot of possible bullish moves by Obama and the Dems could be coming down the pipeline. Next week will be interesting as everybody frets about the technicals of the SP500. Eve...

Doug Kass Calls Another Bottom

Doug Kass is one of our favorite bottom pickers. Though he claims to not be a permabear he is typically paid to short stocks. Whenever he calls a bottom its typically of more meaning then a bull. After all he called the Generational Low back in March of 2009 and now hes placed a bet that the lows have been hit for 2010. Not a big fan of Yahoo! Tech Ticker but today they had OptionMonster's Jon Najarian as the guest host so it was worth checking out.

Demand Builds as Time Passes

Interesting article at theStreet.com by Clay Fisher, son of legendary investor Ken Fisher of Fisher Investments. Truth be told I thought this was an article by legendary short Doug Kass talking about how he turned more bullish. He called the Generational bottom in March 2009 so I thought this was an article about him turning bullish again. Not really sure how I ended up with an article by Clay, but it was an excellent piece so I'm glad to have read it. His basic premise is the same as mine. Corrections are very rare and the economic data clearly does not backup a further dip in the markets. If the economy does lead into a double dip, it's because the markets pushed the economy into such a scenario as buyers freeze purchasing assets from the fear of a tri-peat (is that even a word) of 2000 and 2008. That is the fear after all isn't it? If this was 1999, nobody would think for a second about delaying the purchase of a house to see what happens in the market. Where have the b...

Leading Economic Indicators Jump Again

Though most of the economic data this week has been disappointing (was it really considering the stock market drop and European debt crisis), the Leading Economic Indicators came in at a solid 0.4%. So while the economy and markets might be going through a lull right now, the indicators suggest the expansion should continue. The April number was also raised to 0.0 from -0.1. Need to do some further studying on the implications of the number being above the 2006 peak. In theory, that would mean that the economy at the end of 2010 should be much bigger and stronger then is was prior to the Great Recession. That clearly isn't the case as the market would have to rally nearly 40% to match those totals. "The index points to continued, though slower, U.S. growth for the rest of this year," says Bart van Ark, chief economist of The Conference Board. "Public debt and deficits weigh heavily on growth prospects on both sides of the Atlantic. We project a serious slowdown in Eu...

Market at Tipping Point

Some interesting facts from Sam Stovall of S & P. Basically the market tends to rally prior to a 15% correction. If not, it almost always leads to a new bear market that is defined as 20% down. When hitting a bear market, the average drop is usually 30%. So we either bounce off 1,040 or it really is likely that we hit the 20 or 30% declines. Find it interesting that at times of such well defined trading levels that so many experts like Sam want to 'wait and see'. With commissions so low, it seems better to have bought the lows today with tight stops if the market shows any further weakness leading to the 15% correction and hence likely following panic repeat of 2008. Otherwise, an investor ends up buying at much higher prices in the 1,100 level when it supposedly is safer, but you then risk a drop back to 1,040.

Aggregate Weekly Hours Index

Image
Finally the number that matters the most in the jobs report. The total hours worked is what should indicate the amount of labor demand in the economy. The focus on just new hires seems absurd. Now the demand might be for temp help, or overtime hours, or actually new hires, but the demand is picking up regardless of what the market thought of the jobs report on Friday. Anybody studying the jobs report should already know that the hours worked jumped from 34.1 to 34.2. The economists expected a flat reading with the creation of 150K or so public jobs. Well, we didn't get the jobs, but we did get more hours equivalent to 315K new jobs. Which one is more important? For the economy it doesn't really matter. More hours worked equals more money to spend. For the person looking for a job it matters big time. On the flip side though, the workers getting that extra work are likely very happy to see a much fatter paycheck at this time. Lets just hope for the June report that more focus is...

Chart of the Day: Dow 5000?

Image
Just amazed to see that a full 36% now and over 40% yesterday voted on this CNBC poll for the DOW to hit 5000 by year end. As they say, its difficult for something so drastic to happen if everybody predicts it. In a lot of ways, 2010 seems like the opposite of 2008. Everybody expects the Greece/Euro crisis to lead to Lehman II. The world is so different now. Asia and the US are now strong economies without the threat of a banking system collapse. In 2010, Europe has now pounced on the issue before it spread while the US waited too long thinking real estate was contained to sub-prime. The news of the ban on naked shorting in Germany yesterday likewise drew comparisons to the ban on shorting in the US in Sept 2008. Again, similar sounding situations but likely different outcomes. Germany is no US and naked shorting should be banned. The comparisons are naturally but to think the results will be similar is too simple minded. Everbody expects that. Good summary from the Reformed Trader ...