Posts

Showing posts from July, 2009

IB Net Payout Yields Model

Q2 Inventory Liquidation

Good video from John Ryding, chief economist at RDQ Economics and CNBC's Steve Liesman. Great discussion about the huge inventory liquidation the economy has seen in the first half of '09 and the positive impacts it will likely have on Q3 and Q4 GDP numbers. Anybody against the V shaped recovery just isn't paying attention to the numbers. I agree though that the economy still has structural issues and the Obama administration to deal with to have a robust economy going into 2010. The long term play is still BRIIC markets, but for the rest of the year domestic plays should bounce back nicely.

TerreMark Surges to New Highs

Image
Not sure their is much news today other then a technical breakout. Competitor SVVS had better then expected earnings today so maybe this move is just follow thru combined with a great market today. TMRK continues to be a favorite of StoneFox with there strong ties to this govt that is making a huge push to the internet. Wouldn't chase here, but we definitely aren't selling anytime soon.

Hartford Insurance Not Trading on Earnings Estimates

The current consensus estimates for the Q2 report to be reported by Hartford Insurance (HIG) after the close today is for $1.16. This estimate is pretty much in line with what HIG guided for after the Q1 report. Currently trading only above $15 today suggests that the market gives little value to those estimates. At a run rate above $4, HIG has a PE of just 4. Also with a book value above $40, HIG has two valuation metrics that suggest a much, much higher price. Why isn't it trading higher? Mainly because the market in general expects HIG to warn yet again. They've had a tough year or so and the market is typically slow to change opinions usually requiring a company to prove it first. Take Canseco (CNO) today. They are up 50% based on what appears to be in line results for them. After that, they still only trade at a PE of 3. With the huge rebound in the stock market, it's puzzling why Hartford is being so ignored. So much of their troubles came from investments tied to the

Stat of the Day: Richmond Fed Manufacturing at 3 Year Highs

The Richmond Fed Manufacturing Survey provides one the initial looks into economic data for July and so far it looks very promising. The survey showed a big jump to 14 from 6 and continues the trend of growth in this district. Unfortunately Richmond isn't as important as the Chicago or Empire indexes, but the trend is the key. Just about all activity was better then in June. Orders grew as the fastest rate since March 2004. This should all lead to a much better ISM Manufacturing Index. The Chicago PMI to be reported on Friday is expected to jump to 43 from a 39.9 reading last month. The Richmond report helps support that increase and even though it's still expected to be negative its a huge improvement over June. Looking at the chart of the Richmond Manufacturing Activity it shows what looks like a huge V. And some people still think we won't see a v shaped recovery. Just makes me wonder what charts they are looking at.

Net Payout Yield Portfolio Closing Out First Year on Marketocracy.com

Just wanted to make a quick note that our first year of tracking this portfolio online is coming to a close at the end of this month. The performance has been just as good online as when StoneFox Capital tracked internally for the previous 1.5 years. With just a few days left, the Net Payout Yield Portfolio has outperformed the SP500 by roughly 6.5% points. It has solidly beaten this index in 2007, 2008, and so far in 2009. RETURNS Last Week 3.99% Last Month 8.29% Last 3 Months 20.65% Last 6 Months 21.11% Last 12 Months N/A Last 2 Years N/A Last 3 Years N/A Last 5 Years N/A Since Inception -14.44% (Annualized) -14.59% S&P500 RETURNS Last Week 3.29% Last Month 7.02% Last 3 Months 15.52% Last 6 Months 13.86% Last 12

Rigel Pharma: Importance of Knowing Your Stock

Last Thursday night, Rigel Pharma (RIGL) released disappointing results on its TASKi3 Phase 2b study on Rheumatoid Arthritis (RA). The results showed that the placebo worked basically as well as the R788 pill. Now here is where you need to understand the stock and what was being tested or otherwise you'll be forced into a trading decision by the market and not knowledge. First, this test was only to determine whether the R788 drug worked on RA patients that failed to respond to at least one biologic treatment. Therefore, this result was much less material to the company then the TASKi2 results on July 9th that showed the drug was as effective or more so then existing medicines that typically require shots. "Our objective with R788 in RA is to position the product after methotrexate and before biological therapies are used. We have shown excellent results in that patient population in our earlier TASKi1 and TASKi2 studies, and we believe that patient population represents the

Chart of the Day: Inverted Head and Shoulders

Image
This fancy chart was picked up from CNBC showing what appears to be a huge run up to the 11,600 range on the DOW. It was just 2 weeks ago that people were calling for a H & S formation on the major averages to lead to this huge downfall. Instead we've gotten the reverse. At Stone Fox Capital, we've become bigger users of technical analysis to guide trade decisions. The big Hedge Fund community uses charts for a big portion of their trades making it impossible to ignore. Typically we use them for verification of a trade we've decided to place based on fundamental analysis. Using the chart for entry/exit points has allowed us to make several profitable trades on stocks that we own and limited our downside exposure. For the last few months we've been very bullish on the markets with the hopes of a V shaped recovery. Too many of the analysts and economists proclaiming that such a recovery isn't possible still don't grasp the impacts of a market that will make th

Dick's Takes Advantage of Recession with Store Purchases in Oregon

According to this report , DKS has bought 6 prime store locations from a bankrupt retailer in Oregon. This is a prime example all the strong retailers will take advantage of this recession. They'll continue to gain marketshare. I'm not overly bullish about the retail sector as a whole, but the strong companies will spend the next year or so taking share from the companies going belly up. DKS will be one the big benefitors from this trend as sporting goods is very fragmented and in need of consolidation. They'll eventually be the Best Buy of the sector. The downfall of a regional sporting goods chain in Oregon is providing Dick’s Sporting Goods, Inc. the opportunity to accelerate its expansion plans there. With only one store in Oregon so far, Dick’s (NYSE: DKS ) has committed to take over six former locations of Joe’s Sports, Outdoor & More , a 31-store regional chain based in suburban Portland that went out of business in May after filing for bankruptcy, according t

Trade: Sold Portions of GFA & MICC

Over the last couple of trading days we've sold roughly 30-40% of our holdings in both Gafisa ( GFA ) and Millicom ( MICC ). Both stocks have risen substantially in the last week and at the times of selling they both were more then 25% above the 20EMA. That's usually a good sign of being overbought on the short term. Typically signally a sideways or downward movement next.

Hartford Insurance on the Launch Pad Today

Hartford's (HIG) stock is just soaring up 15% today on a combination of the breakout in the stock market in general and the news from an analyst that it's book value likely increased by 40% in Q2 due to a increase in investments that were unrealized loses. Anybody following HIG should know that around S&P500 900 is where they run into issues of investment losses going from unrealized to potentially realized. If the market bounces back, HIG then wouldn't have the losses to report and instead a $10 stock would have a book value of $40-50. Thats an incredible valuation difference and why HIG might be the biggest gainer in the S&P500 in Q3 if the market continues on a path towards and above 1,000. HIG clearly faces hurdles with potential declines in business, but based on the news from E*Trade (ETFC) last night it doesn't appear that customers are that concerned about doing business with a company in financial trouble, but has a solid business platform. Analysts ex

Genesis Lease Finally Buys Another Plane

While the rest of the airline leasing business has been busy buying either new planes from Airbus or Boeing or working out sale/leaseback arrangemetns with cash strapped carriers, GLS has stayed on the sidelines unwilling to tap its large credit line. At least, until today. GLS announced the purchase of a new A321 and leaseback to US Air. This is significant from a macro economic view because GLS has been on the sidelines all this time. Evidently management sees a bottom in the airplane leasing segment. Their management is widely respected for having performed well at other companies during downturns. The PR also had a hidden announcement that GLS has all 55 aircraft leased now. This is significant because they had 2 aircraft unleased as of the last announcement and its very positive to see them fully booked during the worst economic climate in 70 years. This acquisition now means Genesis has 55 aircraft on lease to 36 airline customers in 21 countries. Considering they and other leasi

Pakistan to Expand Oil Investments

Pakistan has initiated a plan to increase oil and gas investments from $1B to $3B a year or a total of $15B over the next 5 years. This is yet another example of the projects in the works for upgrading the oil and gas infrastructure of the world that has long been neglected. Its also a sign that countries with high growth need more access to oil. Pakistan currently only meets 60% of the energy demands of its 166M citizens (yes it is the 6th largest populated country in the world) with demand expanding by 5% each year. That bill can be dramaticaly decreased if they can expand oil production. What amazes me is that most of the investments will be off the coast of Pakistan (not sure I knew they had a coast). This is very bullish for a deepwater driller like Atwoods (ATW) and possible a infrastructure builder like Foster Wheeler. It isn't really clear where the money will be spent or whether they'll even get the outside investments considering the lack of stability in the country.

Update on the ECRI Weekly Numbers

Poster on one of my favorite blogs, Seekingalpha.com, has a good analysis of the latest info from the ECRI. Anybody following me of late knows that I'm a big fan of studies that focus on the meaning of economic indicators. Whether they are leading, coincidence, or lagging. The Conference Board as a very recognized Leading Indicators that has been pointing up for the last few months. The ECRI has a weekly report this is now showing 7% growth. Now this doesn't translate directly to the GDP rate, but it does predict that the economy is likly to begin growing at a sharp clip. Most analysts that point still have a dire outlook point out that the economy has huge unemployment issues and surely can't start growing until we correct this jobs issue. It seems pretty incredible that anybody claiming to be an economists would ever use a laggigng indicator like jobs. If anythink the massive jobs lost in this Great Recession is what will lead to a strong recovery. Slack in an economy

Stat of the Day: Empire Manufacturing Orders Grow

Empire State Manufacturing Index (New York) came in nearly even today suggesting that the manufacturing sector is about to turn positive. The numbers were sharply higher then expectations and new orders were positive. The big downside was a huge continuation of the inventory reduction. This reduction only makes the recovery much more likely as firms will be required to start increasing inventories to keep up with increasing orders. The Philly Fed Index will be interesting tomorrow. This index was stronger then the Empire one in June and analysts have the same expectations of -5.0. Another strong area would all but put a nail in this recession. New York Federal Reserve's Empire State general business conditions index rose to minus 0.55 in July from minus 9.41 in June July's report on factory activity in New York state was the strongest since April 2008, the last time it was in positive territory. exceeded economists' expectations of minus 5.0, based on the median of forecast

Breakout on Baidu

Image
Baidu (BIDU) has been a favorite of Stone Fox since the low $100s even though we've apparently not written about it much. Internet search in China is just too attractive to have passed up BIDU even back when every stock was going to zero. Today, BIDU has broken out from its recent high of $310 to now trade at $317. Looks very bullish that we'll see much higher prices in the near term. When BIDU originally hit $310, it was very stretched above its moving averages. Now that they've risen BIDU has much more support for another move higher. Edit 4:15pm: added the closing chart to illustrate the breakout. BIDU closed just below $316, but clearly above previous highs.

Bullish Call on Riverbed

It wasn't that long ago that another analyst was busy slamming RVBD saying that checks showed CSCO taking share. Guess that just isn't the case. RVBD is the dominant player in their sector and CSCO has too much other areas to focus on. It also explains why RVBD managed to hold up well in the recent selloff. The market knows! 09-Jul-09 09:02 RVBD Riverbed Technology: RVBD should post strong quarter; Cisco's WAAS mgt software encounters issues - Stifel Nicolaus (21.55 ) Stifel notes that their checks show RVBD should post a strong quarter, beating their est of $93 mln and $0.14 (in line w/consensus). They believe momentum was strong in the service provider and system integrator verticals, their checks show that ahead of releasing a blade for HP's ProCurve switches (at year-end), HP is aggressively pushing RVBD through its sales channel. They expect momentum with HPQ to continue through the course of the year. Their recent checks show that CSCO is not being as aggressive i

The Bullish Case for Commodities

What's interesting about commodities is that when looking at the CRB index, it is basically flat since 2000. A time period in which the world has supposedly seen dramatically higher commodity prices. In reality they went way up and then collapsed back to 2000 levels. Considering that supply never caught up with demand, it makes us very bullish that the next 10 years will see the CRB Index exceed to the 2008 levels as most bull markets last 15-20 years. Iacono Research has a good summary on the bullish case for commodities. Read the whole report, but I liked this section best. These long-term cycles usually last about 15 years and come to an end with production surpluses driven by huge investments in infrastructure, not after a drastic cut in consumption due to a recession, as has been the case in 2008 and 2009. We are likely only about half way through the current commodities bull market, this one interrupted in a similar fashion as the last one back in the 1970s by a brutal r

Another Week of Losses

Back in June it appeared that the market was set for a breakout above the 200EMA just above 940. Now it looks like the SP500 could break down towards at least 830 from a close just below 880 today. What a crazy market it is these days. Whether from fear that Obama is going to destroy the economy from his relentless focus on every subject other then the economy.... healthcare, cap and trade to name a few. To news that investor fear and consumer sentiment have reached levels not seen since March. Really surprising that they fell below April and May levels. What happened to the recovery? If not for the market drop, the US would surely be setup for a strong recovery in the 2nd Half. Just about all of the economic data has reversed course to the point of potentially ending the recession with the July data. Now though we have to deal with a President gone of course and a market about to break. Will Obama wake up and realize we need a strong economy for his initiatives. At least 60% of Americ

Rigel Pharma Surges on Phase IIB Results

This morning Rigel Pharma ( RIGL ) reported results from its Phase IIB study on once daily oral medicine for Rheumatoid Arthritis ( RA ). The results showed that R788 was helpful for most patients with a minor side effect on some patients of higher blood pressure. RIGL remains a favorite high risk biotech play for Stone Fox. The analysts continue with the positive comments and targets in the $30s. We'll likely stay on board for at least the mid $20s. The stock was trading in the $13s after this news so thats a significant gain from here. RIGL theflyonthewall.com: Rigel Pharma's R788 will be partnered in next few months, say Rodman & Renshaw Following positive R788 positive Ph IIb TASKi2 clinical trial results, Rodman & Renshaw said the drug will be partnered in the next few months. Shares are Outperform rated with a $33 price target. 08:13 EDT RIGL theflyonthewall.com: Rigel Pharma positive data could lead to lucrative deal, says Thomas Weisel Thomas Weisel believes

Future Short: Netflix

Netflix (NFLX) has been a favorite short target of Stone Fox for a while. Luckily we've never engaged in more then short term short positions on this stock as its been one of the bright performers during this recession. The recession and high gas prices has in fact likely helped business as consumers have migrated to the cheapest forms of entertainment - DVD rentals via mail. It saves gas and eliminates late fees all for a low monthly subscription fee. Getting DVDs via the mail is clearly a doomed business as even highlighted by the CEO in this Wall Street Journal interview . It's actually pretty incredible that the business model as done so well considering the huge competition in the DVD rental space and the fact that renting by mail was actually seen as a step back for that market. After all, why wait days for a item via the mail when you could just stop at the local store and pick up whatever you wanted and the price of $2-4 per rental didn't seem overly costly. That

Stat of the Day: Weekly Jobless Claims Plunge

The weekly jobless claims for the week ending July 4th were 565K. Substantially lower then expectations around 605K. Being the first week below 600K since January, this was substantially bullish news. The media has trotted out numerous economists to tear down this report as not as good as the headlines due to either holiday shortened week or seasonality issues with autos. Either way, the shortened week and seasonality issues should've been captured in the estimates. CNBC summarized as follows (never mind that the numbers don't add up): The department's seasonal adjustment process expected a large increase in claims from auto workers and other manufacturing workers, the analyst said. Since that didn't occur, seasonally-adjusted claims fell. The non-seasonally adjusted figure increased by about 17,000 to 577,506 initial claims. David Maki from Barclays talks to Bloomberg about the jobless claims report and his expectations for unemployment. Its interesting that he exp

German Recession Already Over?

According to the export numbers in May, the biggest economy in Europe might have already pulled out of recession. Of course, you don't see this new prominent in the media today. All I'm seeing is reports about how the initial jobless claims weren't as good as they were. More about that later. Germany is the largest economy in Europe so this is significant news, but they hardly match up with the US, Japan, or even China. Its a start though and much better then the relentless media coverage about how the recovery isn't taking place. The facts continue to suggest otherwise. Germany, Europe's largest economy, suffered a 3.8 percent contraction in the first quarter and is facing its deepest post-war recession this year, but a 0.3 percent rise in exports in May chimed with other data pointing to a recovery. May industry figures showed output growing at its fastest rate in 16 years, while orders surged to a near two-year high.

Brian Westbury Still Positive on Recovery

Back in early May we reported on how Brian Westbury was calling an end to the recession. At that time we thought the recession was more likely to end around July. On Monday, Brian wrote a market update that confirms his view that in spite of the weak June jobs report that the recovery was still on track. Several metrics reported below in fact typically only take place when the economy is recovering while the jobs report can continue to sputter. And when jobs do sputter it's likely because corporations are reaping huge profits from less employee expenses and higher productivity. The overall ISM Manufacturing index hit 44.8 in June while the production index hit 52.5.The economy is almost always growing when these indexes are at those levels. the four-week moving average for initial claims for unemployment insurance isdown 43,500 (or 7.1%), in the past 2½ months, again something that almost never happens unless the economy is expanding. In addition, personal consumption, new orders

Cramer Rants on Unemployment

On last nights Mad Money show, Jim Cramer ranted about why in the world the market would drop because of weak unemployment numbers (remember its a lagging indicator as well). For the most part, all of the economic numbers have been positive of late except for the June Employment numbers. Why has the market overly focused on it though we've pointed out how all the leading economic indicators are very positive? Think that's the issue when an economy escapes a recession. The market wants to focus on economic indicators even thought the leading ones will be positive and the lagging ones will be negative. Be careful in what you chose to follow. This economy is derailing based on the jobs report. Don't really agree that this is the most important indicator in the market as Cramer states. Its a lagging indicator so how can it be that important? Hours worked, stock market, interest rates, money flow... those are all much more important indicators. They dictate the lagging job

Economic Cycle Research Institute Predicts Recession End

Reading all of the economic news of late, its become important to focus on the leading versus lagging indicators in this economy. The Economic Cycle Research Institute (ECRI) has long been a forecaster of economic cycles and was even very accurate that the 2008 recession would get worse back in March 2008 when a whole slew of economists thought we might even skirt a recession. According to their latest report , the weekly cycle indicators they use continue to show that the recession is in the process of ending. This is contrary to all the news you've probably read since the June jobs report was released last Thursday morning. Jobs of course are a lagging indicator and it amazes me how many economic 'experts' reported that the economy couldn't recover until the jobs improved. Yet every recession has ended long before jobs improve. That's why its so crucial to understand leading versus lagging indicators. I'll have to admit that I'm not all that familiar wit

Stat of the Day: California House Listings at 3.5 Year Low

Image
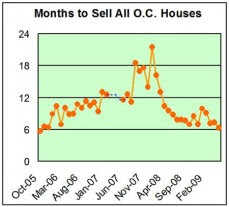
We've reported at numerous times over the last 6 months that the housing market in California is showing signs of bottoming. One of the biggest signs is in this OC Register report that housing listings have hit a level not seen since October 2005. The period when the slump began. From that level the inventory levels continued to soar until mid 2008 causing housing prices to decline. That trend has now completely reversed and the inventory levels are getting pretty low. With interest rates low and housing affordability at highs, these inventory levels are consistent with higher prices going forward. Or at least stable prices that sure beat constant declines. It would take 6.3 months to sell last month’s inventory of houses for sale at May’s sales pace. That’s the lowest level since October 2005, considered the start of the housing slump because sales began to falter then. That’s three months quicker than the year before. The revised May 2008 listings index showed that it would have

Trade: Added More X

US Steel (X) has one of the best symbols. Added more shares to the Growth Portfolio today. The dynamics in the steel industry appear to be improving. Talks by Ford (F) of ramping up auto production will be a big boost to steel production. Think I've seen figures around 18% of steel production goes towards autos. Not to mention that some of the stimulus infrastructure spending should begin starting in the US and other countries. MarketWatch.com has an interesting article about the improving demand seen in the steel markets. Its encouraging that a market bottom has been reached and the all but certain increase in auto demand will help boost this weak sector. The ISM data from yesterday also very much supports this sector. Though X has risen nicely this year, its still trading down roughly 80% off its high of $180. Also its worth noting that X made $18 in earnings in 2008 which is a remarkable amount for a stock now trading at $34. Alpha Natural Resources (ANR) is another stock Ston

Dennis Kneale Outrage

Me thinks the shorts protest way too much on the comments from this CNBC anchor. Lately he has been spewing very bullish themes on his late night show such as the 'Great Recession has Ended'. Based on this clip, the shorts on blogs evidently don't like his calls. Looking at the facts he presents, I'm not sure why everybody is so opposed to his opinion. He clearly lacks detailed knowledge of the financial data points as he typically stumbles through the numbers, but I think hes usually right on spot with his macro view. Based on my work on SeekingAlpha.com and casual reading of other blogs I've noticed a very negative slant to the typical blog. The negative writers seem to have the most followers. Its become cool to be short so maybe the backlash against Kneale isn't that surprising. It's pretty odd to think people are so upset about somebody being bullish. That sure speaks volumes on the negative mindset even after this big rally. In anything, its stirred up

Mike Darda Nails the Jobs Report

And I think he also nails the importance and outcome. Mike predicted a 450K versus the 467K reported. He also went on to say that it wouldn't prevent the equity markets from rallying. Jobs are a lagging indicator after all. If we see companies like increase production in Q3 because of lean inventories, the US will likely see a huge improvement in the jobs reports for July and August. The reported number was much worse then expected, but the expectations seem way off base. With the ADP report on Wednesday and the weakness in the auto sector in June it's hard to figure out why the consensus would be in the 365k range. Regardless the 'worst' then expected numbers were a 'shock' to the equity markets sending them down 2% today. The unemployment rate moved up only 0.1% to 9.5% and that will likely help the markets rally into the close. On the May report the better then expected numbers caused a huge rally to start the day that eventually rolled over as the day when o

Performance Review - Q2

Q2 was generally a spectacular quarter for the markets and Stone Fox Capital. All 3 of our funds were up strongly for the Q and the Growth and Net Payout portfolios had strong beats. In fact Growth was up nearly 30% points more then the SP500. The Hedged portfolio performed slightly below the market average though not to bad considering its cool it to just match the market in bull markets and significantly outperform in bears. After 9 months of tracking, the portfolio is up nearly 26% more then the SP500 and up 7% since inception. Please review the results below for each portfolio realizing that each amount needs to add back 1% to account for the higher fees used by the tracking site marketocracy.com. Basically just add 1% to the annualized figures or .25% for each 3 month period. Growth Portfolio RETURNS Last Week 4.25% Last Month 3.78% Last 3 Months 43.32% Last 6 Months 34.78% Last 12 Months -14.20% Last 2 Y

ISM Data Signals End of Recession

Image
ISM Factory Index today reported a slightly better then expected number of 44.8 which was the highest number since August 2008. Though it still signals contraction, a number above 41.2 has historically coincided with a growing economy. This usually occurs because the US economy has for a long time been growing services and decreasing manufacturing. Not so sure that this report actually signals growth since the service economy may not be growing, but it does bode well that the number is getting much closer to even and signs exist that the car manufacturing will start to ramp back up likely pushing this number into positive territory in the next few months. Edit 7/2: Added the graph. Gives a better picture how the economy has recovered from the Lehman collapse. Its shows how the market could easily rally to pre Lehman collapse levels around 1,200 and that a V shape recovery is more likely then most pundits suggest. Just about every economic graph shows a V shape so why would the sums not