Posts

Showing posts with the label Charts

IB Net Payout Yields Model

The Chart That Should Scare All 3D Systems Bulls

The combination of 3D printing projected to grow annually at 20% and the substantial stock gains in 3D Systems ( DDD ) should already concern longs. The sector is undoubtedly hot and growing sharply, but new investors are paying up front for years of 30% growth long into the future. 3D Systems is a leading provider of 3D printers, print materials, and on-demand customer parts for professionals and consumers. The company has a market value approaching $10 billion, but revenue is only set to reach $515 million in 2013. Even more concerning is the stock price sitting near $100 and earnings per share likely to not even reach a $1. The stock has even gained so much in the last few months that the chart below even shows it out of touch with fellow competitor Stratasys ( SSYS ) . Read the full article at Seeking Alpha. Disclosure: No positions mentioned. Please review the disclaimer page for more details. 

Monster Worldwide Breaks Downtrend

Image
Anybody following the general market and especially this blog already knows about the CEO placing this company up for sale. See previous article on this blog with a link to an article I wrote for Seeking Alpha for more details. Today the stock for Monster Worldwide (MWW) is up another 4% mainly with the general market. Possibly though the technicians are jumping on board as the stock has finally broken a couple of downtrends the last few days. For numerous valuation reasons, it's very logical for the stock to continue pressing above $10 prior to any deal announcements. The biggest risk to price is the next earnings report in April when the attractive balance sheet and brand meets the weak earnings situation. Until then, I'd expect the stock to remain in an uptrend. The biggest question could possibly be whether to cash out if the stock hits in the $12-13 range prior to a deal or wait it out for a possible $15+ as a few analysts suggest might be possible in a deal. For n...

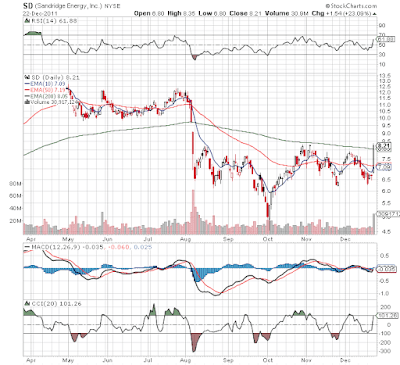
Does Sandridge Energy Have the Perfect Inverse H&S Chart?

Image
Anybody following this blog knows that I've been talking about the inverse Head & Shoulders charts that have shown up lately. The Oil Services (OIH) still has potential as well as the numerous other individual stocks including the one I've mentioned. Today though Sandridge Energy (SD) highlighted how the chart works to perfection. Not only does SD have what amounts to a near perfect shoulder setup, but the stock rocketed 23% on a JV deal. This move helped form what ultimately could be the breakout above the neckline right around todays close around $8. Looks like a move straight up to $12 might be possible now. Anybody catching that reversal near $4.5 in early October is sitting very strong right now. See chart blow. Disclosure: No positions mentioned. Please review the disclaimer page for more details.  Update 12/23 2:40pm: SD jumped to $9 today, but has since fallen back to $8.5. Looks like a clear breakout though the stock quickly stalled.