
Does Sandridge Energy Have the Perfect Inverse H&S Chart?
Anybody following this blog knows that I've been talking about the inverse Head & Shoulders charts that have shown up lately. The Oil Services (OIH) still has potential as well as the numerous other individual stocks including the one I've mentioned.
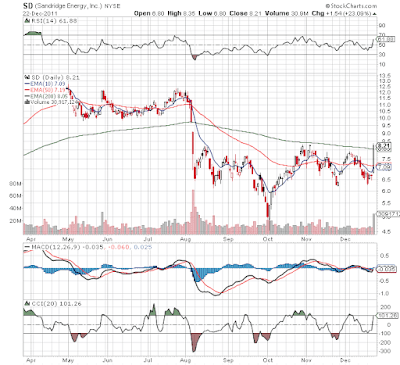
Today though Sandridge Energy (SD) highlighted how the chart works to perfection. Not only does SD have what amounts to a near perfect shoulder setup, but the stock rocketed 23% on a JV deal. This move helped form what ultimately could be the breakout above the neckline right around todays close around $8.
Looks like a move straight up to $12 might be possible now. Anybody catching that reversal near $4.5 in early October is sitting very strong right now. See chart blow.
Disclosure: No positions mentioned. Please review the disclaimer page for more details.
Update 12/23 2:40pm: SD jumped to $9 today, but has since fallen back to $8.5. Looks like a clear breakout though the stock quickly stalled.
Today though Sandridge Energy (SD) highlighted how the chart works to perfection. Not only does SD have what amounts to a near perfect shoulder setup, but the stock rocketed 23% on a JV deal. This move helped form what ultimately could be the breakout above the neckline right around todays close around $8.
Looks like a move straight up to $12 might be possible now. Anybody catching that reversal near $4.5 in early October is sitting very strong right now. See chart blow.

Disclosure: No positions mentioned. Please review the disclaimer page for more details.
Update 12/23 2:40pm: SD jumped to $9 today, but has since fallen back to $8.5. Looks like a clear breakout though the stock quickly stalled.

Comments